YPR196W
No recorded aliases
Function unknown
Best-performing DNA-binding model.
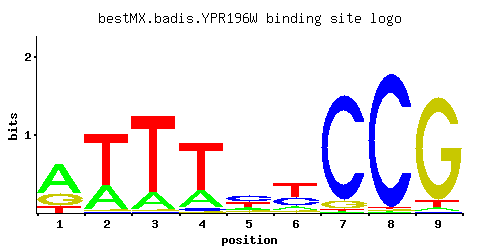
View and copy the recommended matrices ↘
A | 0.60 0.31 0.17 0.24 0.17 0.12 0.01 0.01 0.03
C | 0.01 0.01 0.01 0.04 0.44 0.32 0.91 0.97 0.01
G | 0.26 0.01 0.01 0.02 0.11 0.07 0.07 0.01 0.91
T | 0.13 0.67 0.81 0.70 0.28 0.49 0.01 0.01 0.05
A |  60  31  17  24  17  12   1   1   3
C |   1   1   1   4  44  32  91  97   1
G |  26   1   1   2  11   7   7   1  91
T |  13  67  81  70  28  49   1   1   5
A |  0.63 -0.03 -0.63 -0.29 -0.63 -0.98 -3.47 -3.47 -2.37
C | -2.89 -2.89 -2.89 -1.50  0.89  0.58  1.62  1.68 -2.89
G |  0.37 -2.89 -2.89 -2.20 -0.49 -0.94 -0.94 -2.89  1.62
T | -0.90  0.74  0.93  0.78 -0.13  0.43 -3.47 -3.47 -1.86
Alternative candidate matrices 3
Historical matrix candidates from the original ScerTF database. Expand a source to inspect its original logo, scores, and matrix values.
YPR196WFoat et. al.P = 1View matrix ↘
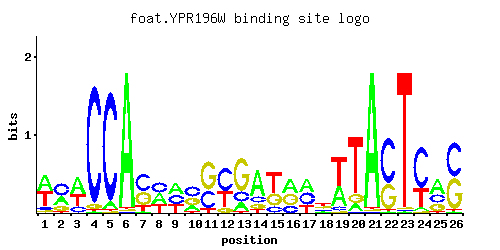
A | 0.01 0.02 0.28 0.97 0.01 0.01 0.77 0.55 0.31 0.22 0.01 0.52 0.08 0.01 0.34 0.08 0.04 0.29 0.29 0.14 0.01 0.01 0.01 0.33 0.03 0.42
C | 0.47 0.24 0.01 0.01 0.35 0.01 0.13 0.01 0.31 0.01 0.37 0.32 0.12 0.65 0.12 0.57 0.30 0.01 0.01 0.36 0.01 0.01 0.04 0.01 0.20 0.05
G | 0.51 0.26 0.66 0.01 0.64 0.01 0.01 0.07 0.23 0.38 0.22 0.16 0.16 0.20 0.53 0.35 0.43 0.34 0.35 0.49 0.01 0.92 0.94 0.19 0.44 0.09
T | 0.01 0.48 0.05 0.01 0.01 0.97 0.10 0.37 0.14 0.40 0.41 0.01 0.64 0.15 0.01 0.01 0.22 0.37 0.35 0.02 0.97 0.06 0.01 0.47 0.32 0.44
A |   1   2  28  97   1   1  77  55  31  22   1  52   8   1  34   8   4  28  28  14   1   1   1  33   3  42
C |  47  24   1   1  35   1  13   1  31   1  37  32  12  65  12  56  30   1   1  36   1   1   4   1  20   5
G |  51  26  66   1  64   1   1   7  23  38  22  16  16  20  53  35  43  34  35  49   1  92  94  19  44   9
T |   1  48   5   1   1  97  10  37  14  40  41   1  64  15   1   1  22  37  35   2  97   6   1  47  32  44
A | -3.47 -2.77 -0.13  1.11 -3.47 -3.47  0.88  0.54 -0.03 -0.37 -3.47  0.49 -1.39 -3.47  0.06 -1.39 -2.08 -0.10 -0.10 -0.83 -3.47 -3.47 -3.47  0.03 -2.37  0.27
C |  0.96  0.29 -2.89 -2.89  0.66 -2.89 -0.33 -2.89  0.54 -2.89  0.72  0.58 -0.41  1.28 -0.41  1.15  0.51 -2.89 -2.89  0.69 -2.89 -2.89 -1.50 -2.89  0.11 -1.28
G |  1.04  0.37  1.30 -2.89  1.27 -2.89 -2.89 -0.94  0.25  0.75  0.20 -0.12 -0.12  0.11  1.08  0.66  0.87  0.64  0.66  1.00 -2.89  1.63  1.65  0.05  0.89 -0.69
T | -3.47  0.41 -1.86 -3.47 -3.47  1.11 -1.16  0.15 -0.83  0.22  0.25 -3.47  0.69 -0.76 -3.47 -3.47 -0.37  0.15  0.09 -2.77  1.11 -1.67 -3.47  0.38  0.00  0.32
YPR196WZhu et. al.P = 0.4795View matrix ↘
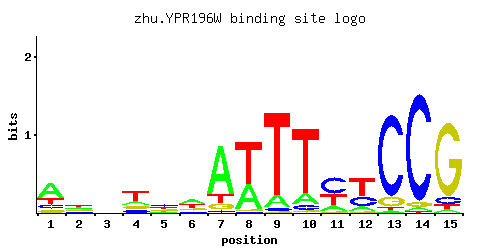
A | 0.56 0.28 0.24 0.17 0.15 0.38 0.74 0.36 0.11 0.12 0.16 0.14 0.02 0.03 0.03
C | 0.15 0.19 0.30 0.16 0.35 0.10 0.03 0.01 0.03 0.06 0.50 0.29 0.86 0.92 0.08
G | 0.11 0.19 0.24 0.16 0.23 0.23 0.10 0.02 0.01 0.02 0.03 0.04 0.11 0.04 0.83
T | 0.18 0.34 0.21 0.51 0.27 0.29 0.13 0.62 0.84 0.79 0.31 0.52 0.02 0.01 0.05
A |  56  28  24  17  15  38  74  36  11  12  16  14   2   3   3
C |  15  19  30  16  35  10   3   1   3   6  50  28  86  92   8
G |  11  19  24  16  23  23  10   2   1   2   3   4  11   4  83
T |  18  34  21  51  27  28  13  62  84  79  31  52   2   1   5
A |  0.56 -0.13 -0.29 -0.63 -0.76  0.17  0.84  0.12 -1.07 -0.98 -0.69 -0.83 -2.77 -2.37 -2.37
C | -0.18  0.05  0.51 -0.12  0.66 -0.59 -1.79 -2.89 -1.79 -1.10  1.02  0.48  1.56  1.63 -0.81
G | -0.49  0.05  0.29 -0.12  0.25  0.25 -0.59 -2.20 -2.89 -2.20 -1.79 -1.50 -0.49 -1.50  1.53
T | -0.58  0.06 -0.42  0.47 -0.17 -0.10 -0.90  0.66  0.97  0.90 -0.03  0.49 -2.77 -3.47 -1.86
YPR196WZhao and StormoP = 1View matrix ↘
A | 0.228 0.248 0.294 0.253 0.301 0.289 0.334 0.417
C | 0.308 0.234 0.201 0.241 0.192 0.197 0.147 0.177
G | 0.271 0.325 0.306 0.256 0.284 0.280 0.299 0.231
T | 0.193 0.193 0.199 0.251 0.223 0.234 0.220 0.175
A |  22  24  29  25  30  28  33  41
C |  30  23  20  24  19  19  14  17
G |  27  32  30  25  28  28  29  23
T |  19  19  19  25  22  23  22  17
A | -0.34 -0.25 -0.08 -0.23 -0.06 -0.10  0.04  0.26
C |  0.54  0.26  0.11  0.29  0.06  0.09 -0.20 -0.02
G |  0.41  0.59  0.53  0.35  0.46  0.44  0.51  0.25
T | -0.51 -0.51 -0.48 -0.24 -0.36 -0.31 -0.37 -0.60
Gene-level annotations and interactions.
Genes bound in ChIP-chip experiments 20 genes
YAR019C, YBL095W, YCR018C-A, YCR019W, YDR543C, YER189W, YER190W, YGL258W, YHR073W, YHR091C, YJL134W, YJL135W, YJL136C, YLR463C, YLR465C, YLR467W, YNL337W, YNL338W, YNL339C, YOL160W
Genes affected by TF deletion 63 genes
YDR370C, YOL015W, YOL047C, YDR222W, YHR146W, YJL115W, YDL127W, YPL014W, YMR103C, YGR250C, YBR129C, YJL017W, YMR104C, YMR136W, YER029C, YLR183C, YCR021C, YDR074W, YOR267C, YKL051W, YLR438C-A, YMR199W, YOR074C, YOR384W, YFR017C, YMR145C, YNL309W, YIR035C, YMR144W, YNL120C, YOL149W, YPL275W, YBR264C, YER064C, YNL310C, YOR273C, YGR138C, YHR160C, YNL289W, YGR139W, YDL048C, YGR079W, YLR384C, YOR305W, YOR367W, YNL160W, YBR054W, YLR297W, YHR200W, YDR055W, YMR034C, YMR181C, YMR250W, YDL025C, YDL056W, YDR488C, YGR023W, YGR051C, YHR079C-A, YJR141W, YNL169C, YOL101C, YNR019W
Predicted TF–TF partners 8 genes
CIN5, GSM1, IME1, MIG3, OAF1, PDR8, RGT1, UME6