← All factors / TF RECORD
YLL054C
No recorded aliases
Function unknown
01 / RECOMMENDED MATRIX
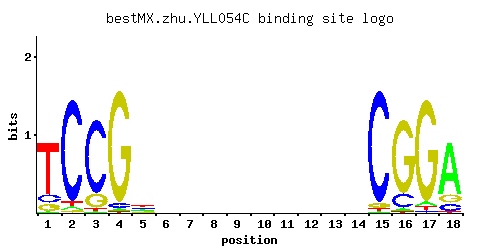
Best-performing DNA-binding model.
Fisher’s P-valueNo data
Information content12.83
Max PWM score14.53
Recommended cutoff10.89
View and copy the recommended matrices ↘
Position frequency matrix (PFM)
A | 0.02 0.03 0.01 0.02 0.20 0.25 0.25 0.25 0.25 0.25 0.25 0.25 0.25 0.25 0.01 0.02 0.04 0.75
C | 0.12 0.91 0.81 0.04 0.25 0.25 0.25 0.25 0.25 0.25 0.25 0.25 0.25 0.25 0.93 0.16 0.02 0.11
G | 0.11 0.02 0.16 0.93 0.19 0.25 0.25 0.25 0.25 0.25 0.25 0.25 0.25 0.25 0.04 0.81 0.91 0.12
T | 0.75 0.04 0.02 0.01 0.35 0.25 0.25 0.25 0.25 0.25 0.25 0.25 0.25 0.25 0.02 0.01 0.03 0.02
Position count matrix (PCM)
A |   2   3   1   2  20  25  25  25  25  25  25  25  25  25   1   2   4  75
C |  12  91  81   4  25  25  25  25  25  25  25  25  25  25  93  16   2  11
G |  11   2  16  93  19  25  25  25  25  25  25  25  25  25   4  81  91  12
T |  75   4   2   1  35  25  25  25  25  25  25  25  25  25   2   1   3   2
Position weight matrix (PWM)
A | -2.77 -2.37 -3.47 -2.77 -0.47 -0.25 -0.25 -0.25 -0.25 -0.25 -0.25 -0.25 -0.25 -0.25 -3.47 -2.77 -2.08  0.85
C | -0.41  1.62  1.50 -1.50  0.33  0.33  0.33  0.33  0.33  0.33  0.33  0.33  0.33  0.33  1.64 -0.12 -2.20 -0.49
G | -0.49 -2.20 -0.12  1.64  0.05  0.33  0.33  0.33  0.33  0.33  0.33  0.33  0.33  0.33 -1.50  1.50  1.62 -0.41
T |  0.85 -2.08 -2.77 -3.47  0.09 -0.25 -0.25 -0.25 -0.25 -0.25 -0.25 -0.25 -0.25 -0.25 -2.77 -3.47 -2.37 -2.77
02 / COMPARATIVE BENCHMARKS
Alternative candidate matrices 2
Historical matrix candidates from the original ScerTF database. Expand a source to inspect its original logo, scores, and matrix values.
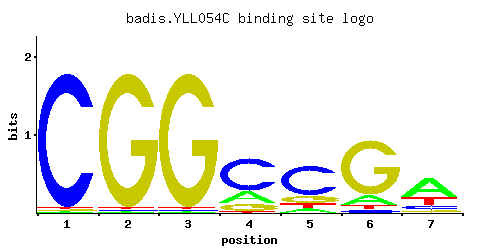
YLL054CBadis et. al.P = No dataView matrix ↘
Fisher’s P-valueNo data
Information content9.913
Max PWM score9.65
Recommended cutoff7.24
Position frequency matrix (PFM)
A | 0.01 0.01 0.01 0.21 0.09 0.13 0.58
C | 0.97 0.01 0.01 0.64 0.66 0.05 0.14
G | 0.01 0.97 0.97 0.14 0.16 0.77 0.07
T | 0.01 0.01 0.01 0.01 0.09 0.05 0.21
Position count matrix (PCM)
A |   1   1   1  21   9  13  57
C |  97   1   1  64  66   5  14
G |   1  97  97  14  16  77   7
T |   1   1   1   1   9   5  21
Position weight matrix (PWM)
A | -3.47 -3.47 -3.47 -0.42 -1.27 -0.90  0.59
C |  1.68 -2.89 -2.89  1.27  1.30 -1.28 -0.25
G | -2.89  1.68  1.68 -0.25 -0.12  1.45 -0.94
T | -3.47 -3.47 -3.47 -3.47 -1.27 -1.86 -0.42
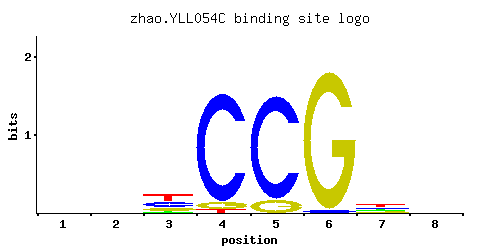
YLL054CZhao and StormoP = No dataView matrix ↘
Fisher’s P-valueNo data
Information content6.63
Max PWM score6.88
Recommended cutoff5.16
Position frequency matrix (PFM)
A | 0.266 0.326 0.003 0.001 0.023 0.391 0.277 0.308
C | 0.253 0.137 0.972 0.109 0.060 0.202 0.220 0.219
G | 0.233 0.273 0.024 0.889 0.916 0.330 0.203 0.267
T | 0.248 0.264 0.001 0.001 0.001 0.076 0.300 0.206
Position count matrix (PCM)
A |  26  32   0   0   2  39  27  30
C |  25  13  97  10   6  20  22  21
G |  23  27   2  88  91  33  20  26
T |  24  26   0   0   0   7  30  20
Position weight matrix (PWM)
A | -0.18  0.02 -4.67 -5.77 -2.63  0.20 -0.14 -0.04
C |  0.34 -0.27  1.69 -0.50 -1.10  0.12  0.20  0.20
G |  0.26  0.42 -2.01  1.60  1.63  0.61  0.12  0.39
T | -0.25 -0.19 -5.77 -5.77 -5.77 -1.44 -0.06 -0.44
03 / EXPERIMENTAL CONTEXT
Gene-level annotations and interactions.
Genes bound in ChIP-chip experiments 1 genes
No Data
Genes affected by TF deletion 1 genes
No Data
Genes supported by both experiments 1 genes
No Data