YAP3
YHL009C
Basic leucine zipper (bZIP) transcription factor
Best-performing DNA-binding model.
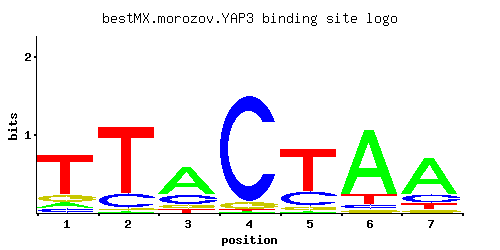
View and copy the recommended matrices ↘
A | 0.089 0.015 0.629 0.011 0.011 0.800 0.692
C | 0.069 0.166 0.215 0.914 0.238 0.045 0.150
G | 0.132 0.030 0.086 0.063 0.073 0.036 0.059
T | 0.710 0.789 0.069 0.012 0.678 0.118 0.099
A |   8   1  62   1   1  80  69
C |   6  16  21  91  23   4  15
G |  13   3   8   6   7   3   5
T |  71  78   6   1  67  11   9
A | -1.28 -3.06  0.68 -3.37 -3.37  0.92  0.77
C | -0.96 -0.08  0.18  1.62  0.28 -1.39 -0.18
G | -0.31 -1.79 -0.74 -1.05 -0.90 -1.61 -1.12
T |  0.80  0.90 -1.53 -3.28  0.75 -1.00 -1.17
Alternative candidate matrices 8
Historical matrix candidates from the original ScerTF database. Expand a source to inspect its original logo, scores, and matrix values.
YAP3Badis et. al.P = 0.3335View matrix ↘
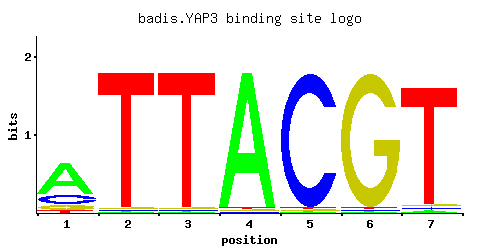
A | 0.65 0.01 0.01 0.97 0.01 0.01 0.02
C | 0.19 0.01 0.01 0.01 0.97 0.01 0.02
G | 0.12 0.01 0.01 0.01 0.01 0.97 0.02
T | 0.04 0.97 0.97 0.01 0.01 0.01 0.94
A |  65   1   1  97   1   1   2
C |  19   1   1   1  97   1   2
G |  12   1   1   1   1  97   2
T |   4  97  97   1   1   1  94
A |  0.71 -3.47 -3.47  1.11 -3.47 -3.47 -2.77
C |  0.05 -2.89 -2.89 -2.89  1.68 -2.89 -2.20
G | -0.41 -2.89 -2.89 -2.89 -2.89  1.68 -2.20
T | -2.08  1.11  1.11 -3.47 -3.47 -3.47  1.08
YAP3_AFoat et. al.P = 0.05223View matrix ↘
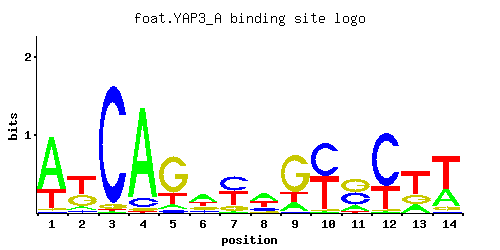
A | 0.61 0.56 0.29 0.02 0.49 0.17 0.30 0.40 0.21 0.19 0.01 0.01 0.51 0.25
C | 0.08 0.23 0.01 0.43 0.01 0.68 0.09 0.15 0.19 0.68 0.03 0.04 0.34 0.03
G | 0.01 0.01 0.70 0.37 0.50 0.01 0.18 0.43 0.12 0.05 0.09 0.95 0.05 0.01
T | 0.31 0.20 0.01 0.17 0.01 0.15 0.43 0.02 0.48 0.07 0.87 0.01 0.10 0.71
A |  61  56  28   2  49  17  30  40  21  19   1   1  51  25
C |   8  23   1  43   1  68   9  15  19  68   3   4  34   3
G |   1   1  70  37  50   1  18  43  12   5   9  95   5   1
T |  31  20   1  17   1  15  43   2  48   7  87   1  10  71
A |  0.65  0.56 -0.10 -2.77  0.43 -0.63 -0.06  0.22 -0.42 -0.52 -3.47 -3.47  0.47 -0.25
C | -0.81  0.25 -2.89  0.87 -2.89  1.33 -0.69 -0.18  0.05  1.33 -1.79 -1.50  0.64 -1.79
G | -2.89 -2.89  1.36  0.72  1.02 -2.89  0.00  0.87 -0.41 -1.28 -0.69  1.66 -1.28 -2.89
T | -0.03 -0.47 -3.47 -0.63 -3.47 -0.76  0.30 -2.77  0.41 -1.52  1.00 -3.47 -1.16  0.80
YAP3_BFoat et. al.P = 1View matrix ↘
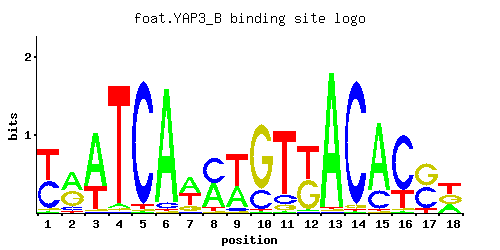
A | 0.01 0.46 0.69 0.03 0.01 0.93 0.47 0.45 0.37 0.01 0.01 0.02 0.97 0.01 0.77 0.01 0.01 0.30
C | 0.45 0.10 0.01 0.01 0.95 0.05 0.02 0.49 0.06 0.22 0.12 0.01 0.01 0.95 0.21 0.74 0.45 0.01
G | 0.03 0.41 0.01 0.02 0.01 0.01 0.17 0.01 0.01 0.76 0.08 0.46 0.01 0.03 0.01 0.03 0.46 0.33
T | 0.51 0.03 0.30 0.94 0.03 0.01 0.35 0.06 0.57 0.01 0.79 0.51 0.01 0.01 0.01 0.23 0.08 0.37
A |   1  46  69   3   1  93  47  45  37   1   1   2  97   1  77   1   1  30
C |  45  10   1   1  95   5   2  49   6  22  12   1   1  95  21  74  45   1
G |   3  41   1   2   1   1  17   1   1  76   8  46   1   3   1   3  46  33
T |  51   3  30  94   3   1  35   6  56   1  79  51   1   1   1  23   8  37
A | -3.47  0.36  0.77 -2.37 -3.47  1.07  0.38  0.34  0.15 -3.47 -3.47 -2.77  1.11 -3.47  0.88 -3.47 -3.47 -0.06
C |  0.92 -0.59 -2.89 -2.89  1.66 -1.28 -2.20  1.00 -1.10  0.20 -0.41 -2.89 -2.89  1.66  0.15  1.41  0.92 -2.89
G | -1.79  0.82 -2.89 -2.20 -2.89 -2.89 -0.06 -2.89 -2.89  1.44 -0.81  0.94 -2.89 -1.79 -2.89 -1.79  0.94  0.61
T |  0.47 -2.37 -0.06  1.08 -2.37 -3.47  0.09 -1.67  0.58 -3.47  0.90  0.47 -3.47 -3.47 -3.47 -0.33 -1.39  0.15
YAP3_AFordyce et. al.P = 0.1865View matrix ↘
YAP3_BFordyce et. al.P = 0.3139View matrix ↘
YAP3_CFordyce et. al.P = 0.09187View matrix ↘
YAP3Harbison et. al.P = 0.05633View matrix ↘
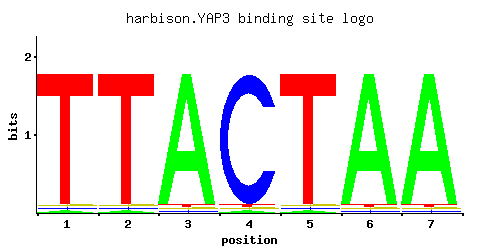
A | 0.012 0.012 0.964 0.012 0.012 0.964 0.964
C | 0.012 0.012 0.012 0.965 0.012 0.012 0.012
G | 0.012 0.012 0.012 0.012 0.012 0.012 0.012
T | 0.964 0.964 0.012 0.012 0.964 0.012 0.012
A |   1   1  96   1   1  96  96
C |   1   1   1  96   1   1   1
G |   1   1   1   1   1   1   1
T |  96  96   1   1  96   1   1
A | -3.28 -3.28  1.10 -3.28 -3.28  1.10  1.10
C | -2.71 -2.71 -2.71  1.68 -2.71 -2.71 -2.71
G | -2.71 -2.71 -2.71 -2.71 -2.71 -2.71 -2.71
T |  1.10  1.10 -3.28 -3.28  1.10 -3.28 -3.28
YAP3Macisaac et. alP = 0.05633View matrix ↘
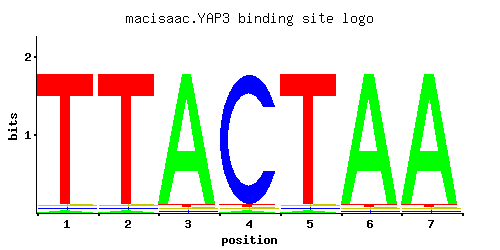
A | 0.012 0.012 0.964 0.012 0.012 0.964 0.964
C | 0.012 0.012 0.012 0.964 0.012 0.012 0.012
G | 0.012 0.012 0.012 0.012 0.012 0.012 0.012
T | 0.964 0.964 0.012 0.012 0.964 0.012 0.012
A |   1   1  96   1   1  96  96
C |   1   1   1  96   1   1   1
G |   1   1   1   1   1   1   1
T |  96  96   1   1  96   1   1
A | -3.28 -3.28  1.10 -3.28 -3.28  1.10  1.10
C | -2.71 -2.71 -2.71  1.68 -2.71 -2.71 -2.71
G | -2.71 -2.71 -2.71 -2.71 -2.71 -2.71 -2.71
T |  1.10  1.10 -3.28 -3.28  1.10 -3.28 -3.28
Gene-level annotations and interactions.
Genes bound in ChIP-chip experiments 84 genes
YAR009C, YAR035W, YBL001C, YBR040W, YBR041W, YBR057C, YBR102C, YBR103W, YBR143C, YBR232C, YCR042C, YCR096C, YDL092W, YDL094C, YDL127W, YDL161W, YDL163W, YDL164C, YDR160W, YDR319C, YDR461W, YEL002C, YER013W, YGL047W, YGL048C, YGL108C, YGL178W, YGL205W, YGL206C, YGL249W, YHL008C, YHR155W, YHR178W, YIL116W, YIL117C, YJR044C, YJR154W, YKL009W, YKL010C, YKR035C, YKR073C, YLL035W, YLL036C, YLL038C, YLR006C, YLR007W, YLR035C-A, YLR207W, YLR292C, YLR346C, YLR425W, YLR452C, YLR463C, YLR465C, YLR467W, YML055W, YML056C, YML082W, YML083C, YML116W, YMR135W-A, YMR193W, YMR283C, YNL025C, YNL048W, YNL049C, YNL145W, YNR011C, YNR012W, YOL042W, YOL043C, YOL142W, YOL143C, YOR033C, YOR074C, YOR075W, YOR093C, YOR094W, YOR129C, YOR148C, YPL257W-A, YPL257W-B, YPR048W, YPR183W
Genes affected by TF deletion 113 genes
YCR040W, YGL199C, YGR280C, YIL084C, YKR012C, YGL009C, YPL019C, YCR013C, YCR041W, YKR013W, YML113W, YMR044W, YOR194C, YOR226C, YCR097W-A, YHR143W-A, YPR079W, YPR140W, YCR073W-A, YFR005C, YGR005C, YHR025W, YLR340W, YOR351C, YPL187W, YHR208W, YML085C, YBR067C, YDR461W, YFR006W, YHR021C, YHR026W, YLR339C, YNL146W, YPR015C, YCL012W, YCL018W, YDR281C, YIL015W, YML055W, YMR253C, YNL300W, YNR071C, YOR229W, YDR077W, YER154W, YNL057W, YJR148W, YAL012W, YER001W, YLR440C, YDR502C, YMR113W, YOL144W, YPR026W, YPL195W, YBR265W, YKL209C, YKL178C, YLR343W, YLR349W, YOL111C, YOL143C, YNR043W, YCL027W, YJL158C, YKL177W, YNL308C, YCR059C, YKR093W, YOR239W, YOR243C, YLR040C, YLR416C, YLR420W, YDL058W, YCL066W, YKR086W, YOR210W, YLR454W, YKL120W, YLR041W, YML010W, YCR097W, YFL026W, YKL032C, YOL126C, YGL089C, YBR145W, YDL014W, YFL023W, YJR004C, YKL216W, YNR044W, YNL322C, YGL226W, YLR303W, YOR247W, YPL043W, YGL224C, YHL009C, YLR267W, YLR302C, YOR246C, YOR248W, YGL032C, YPL044C, YOR034C, YCL009C, YGR274C, YMR094W, YER073W, YOR152C
Genes supported by both experiments 3 genes
YDR461W, YML055W, YOL143C