YAP1
YML007W, SNQ3, PAR1
Basic leucine zipper (bZIP) transcription factor required for oxidative stress tolerance; activated by H2O2 through the multistep formation of disulfide bonds and transit from the cytoplasm to the nucleus; mediates resistance to cadmium
Best-performing DNA-binding model.
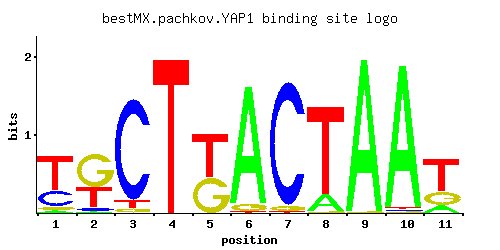
View and copy the recommended matrices ↘
A | 0.032 0.009 0.001 0.001 0.001 0.934 0.003 0.152 0.996 0.982 0.131
C | 0.288 0.057 0.901 0.001 0.001 0.003 0.949 0.001 0.001 0.006 0.001
G | 0.053 0.591 0.037 0.001 0.455 0.055 0.039 0.007 0.004 0.004 0.262
T | 0.626 0.344 0.062 1.000 0.545 0.009 0.009 0.840 0.001 0.009 0.607
A |   3   0   0   0   0  93   0  15  99  98  13
C |  28   5  90   0   0   0  94   0   0   0   0
G |   5  59   3   0  45   5   3   0   0   0  26
T |  62  34   6 100  54   0   0  84   0   0  60
A | -2.30 -3.57 -5.77 -5.77 -5.77  1.07 -4.67 -0.74  1.14  1.12 -0.89
C |  0.47 -1.15  1.61 -5.19 -5.19 -4.09  1.66 -5.19 -5.19 -3.40 -5.19
G | -1.22  1.19 -1.58 -5.19  0.93 -1.19 -1.53 -3.25 -3.81 -3.81  0.38
T |  0.67  0.07 -1.64  1.14  0.53 -3.57 -3.57  0.97 -5.77 -3.57  0.64
Alternative candidate matrices 12
Historical matrix candidates from the original ScerTF database. Expand a source to inspect its original logo, scores, and matrix values.
YAP1_AFoat et. al.P = 1View matrix ↘
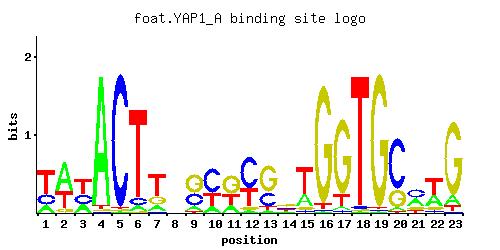
A | 0.18 0.58 0.25 0.97 0.01 0.05 0.15 0.29 0.10 0.15 0.20 0.03 0.05 0.17 0.26 0.01 0.03 0.01 0.01 0.04 0.34 0.33 0.10
C | 0.25 0.01 0.28 0.01 0.97 0.07 0.04 0.25 0.34 0.57 0.01 0.61 0.30 0.25 0.05 0.01 0.02 0.02 0.01 0.72 0.44 0.06 0.01
G | 0.01 0.09 0.01 0.01 0.01 0.01 0.23 0.19 0.51 0.01 0.51 0.05 0.58 0.36 0.08 0.94 0.83 0.01 0.97 0.24 0.15 0.10 0.82
T | 0.56 0.33 0.46 0.02 0.01 0.87 0.58 0.26 0.04 0.28 0.29 0.32 0.06 0.21 0.60 0.04 0.12 0.96 0.01 0.01 0.08 0.51 0.06
A |  18  57  25  97   1   5  15  28  10  15  20   3   5  17  26   1   3   1   1   4  34  33  10
C |  25   1  28   1  97   7   4  25  34  56   1  61  30  25   5   1   2   2   1  72  44   6   1
G |   1   9   1   1   1   1  23  19  51   1  51   5  57  36   8  94  83   1  97  24  15  10  82
T |  56  33  46   2   1  87  57  26   4  28  28  32   6  21  60   4  12  96   1   1   8  51   6
A | -0.58  0.59 -0.25  1.11 -3.47 -1.86 -0.76 -0.10 -1.16 -0.76 -0.47 -2.37 -1.86 -0.63 -0.21 -3.47 -2.37 -3.47 -3.47 -2.08  0.06  0.03 -1.16
C |  0.33 -2.89  0.44 -2.89  1.68 -0.94 -1.50  0.33  0.64  1.15 -2.89  1.22  0.51  0.33 -1.28 -2.89 -2.20 -2.20 -2.89  1.39  0.89 -1.10 -2.89
G | -2.89 -0.69 -2.89 -2.89 -2.89 -2.89  0.25  0.05  1.04 -2.89  1.04 -1.28  1.17  0.69 -0.81  1.65  1.53 -2.89  1.68  0.29 -0.18 -0.59  1.52
T |  0.56  0.03  0.36 -2.77 -3.47  1.00  0.59 -0.21 -2.08 -0.13 -0.10  0.00 -1.67 -0.42  0.63 -2.08 -0.98  1.10 -3.47 -3.47 -1.39  0.47 -1.67
YAP1_BFoat et. al.P = 1.05e-14View matrix ↘
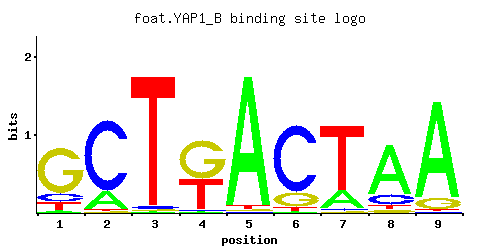
A | 0.01 0.05 0.76 0.03 0.02 0.43 0.96 0.01 0.11
C | 0.10 0.05 0.01 0.17 0.01 0.56 0.01 0.01 0.73
G | 0.01 0.16 0.02 0.79 0.01 0.01 0.02 0.79 0.13
T | 0.88 0.75 0.20 0.01 0.96 0.01 0.01 0.19 0.03
A |   1   5  76   3   2  43  96   1  11
C |  10   5   1  17   1  56   1   1  73
G |   1  16   2  79   1   1   2  79  13
T |  88  75  20   1  96   1   1  19   3
A | -3.47 -1.86  0.86 -2.37 -2.77  0.30  1.10 -3.47 -1.07
C | -0.59 -1.28 -2.89 -0.06 -2.89  1.13 -2.89 -2.89  1.40
G | -2.89 -0.12 -2.20  1.48 -2.89 -2.89 -2.20  1.48 -0.33
T |  1.01  0.85 -0.47 -3.47  1.10 -3.47 -3.47 -0.52 -2.37
YAP1_CFoat et. al.P = 1View matrix ↘
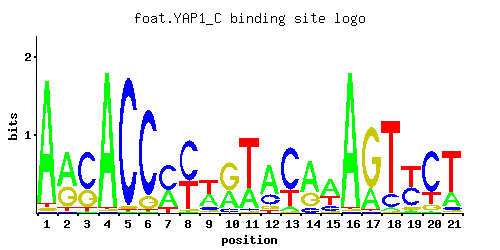
A | 0.96 0.59 0.02 0.97 0.01 0.01 0.35 0.01 0.40 0.33 0.26 0.63 0.07 0.61 0.53 0.97 0.24 0.03 0.04 0.01 0.22
C | 0.01 0.01 0.65 0.01 0.96 0.85 0.55 0.58 0.09 0.09 0.03 0.24 0.68 0.11 0.17 0.01 0.01 0.15 0.42 0.70 0.05
G | 0.02 0.36 0.29 0.01 0.02 0.13 0.01 0.01 0.07 0.57 0.01 0.10 0.01 0.28 0.04 0.01 0.74 0.01 0.06 0.11 0.04
T | 0.02 0.05 0.05 0.01 0.01 0.01 0.10 0.40 0.44 0.01 0.69 0.04 0.24 0.01 0.26 0.01 0.01 0.81 0.48 0.19 0.69
A |  96  59   2  97   1   1  35   1  40  33  26  63   7  61  53  97  24   3   4   1  22
C |   1   1  65   1  96  85  55  57   9   9   3  24  68  11  17   1   1  15  42  70   5
G |   2  36  28   1   2  13   1   1   7  56   1  10   1  28   4   1  74   1   6  11   4
T |   2   5   5   1   1   1  10  40  44   1  69   4  24   1  26   1   1  81  48  19  69
A |  1.10  0.61 -2.77  1.11 -3.47 -3.47  0.09 -3.47  0.22  0.03 -0.21  0.68 -1.52  0.65  0.50  1.11 -0.29 -2.37 -2.08 -3.47 -0.37
C | -2.89 -2.89  1.28 -2.89  1.67  1.55  1.12  1.17 -0.69 -0.69 -1.79  0.29  1.33 -0.49 -0.06 -2.89 -2.89 -0.18  0.85  1.36 -1.28
G | -2.20  0.69  0.48 -2.89 -2.20 -0.33 -2.89 -2.89 -0.94  1.15 -2.89 -0.59 -2.89  0.44 -1.50 -2.89  1.41 -2.89 -1.10 -0.49 -1.50
T | -2.77 -1.86 -1.86 -3.47 -3.47 -3.47 -1.16  0.22  0.32 -3.47  0.77 -2.08 -0.29 -3.47 -0.21 -3.47 -3.47  0.93  0.41 -0.52  0.77
YAP1_DFoat et. al.P = 1.44e-15View matrix ↘
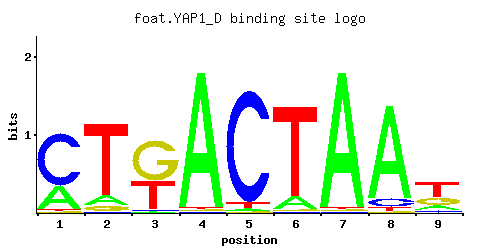
A | 0.30 0.11 0.01 0.97 0.02 0.12 0.97 0.88 0.15
C | 0.69 0.01 0.01 0.01 0.92 0.01 0.01 0.08 0.07
G | 0.01 0.06 0.58 0.01 0.01 0.01 0.01 0.01 0.25
T | 0.01 0.82 0.40 0.01 0.04 0.87 0.01 0.03 0.53
A |  30  11   1  97   2  12  97  88  15
C |  69   1   1   1  92   1   1   8   7
G |   1   6  57   1   1   1   1   1  25
T |   1  82  40   1   4  87   1   3  53
A | -0.06 -1.07 -3.47  1.11 -2.77 -0.98  1.11  1.01 -0.76
C |  1.34 -2.89 -2.89 -2.89  1.63 -2.89 -2.89 -0.81 -0.94
G | -2.89 -1.10  1.17 -2.89 -2.89 -2.89 -2.89 -2.89  0.33
T | -3.47  0.94  0.22 -3.47 -2.08  1.00 -3.47 -2.37  0.50
YAP1_AFordyce et. al.P = 0.0004362View matrix ↘
YAP1_BFordyce et. al.P = 0.002881View matrix ↘
YAP1_CFordyce et. al.P = 0.0002793View matrix ↘
YAP1Harbison et. al.P = 4.94e-16View matrix ↘
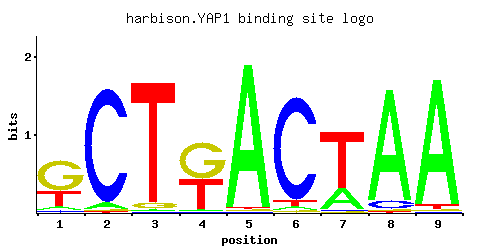
A | 0.034 0.006 0.711 0.046 0.008 0.437 0.939 0.007 0.281
C | 0.010 0.010 0.011 0.018 0.005 0.541 0.051 0.011 0.618
G | 0.005 0.065 0.013 0.912 0.005 0.010 0.004 0.929 0.036
T | 0.951 0.920 0.265 0.025 0.981 0.013 0.006 0.052 0.065
A |   3   0  71   4   0  43  93   0  28
C |   1   1   1   1   0  54   5   1  61
G |   0   6   1  91   0   1   0  92   3
T |  95  92  26   2  98   1   0   5   6
A | -2.24 -3.98  0.80 -1.94 -3.69  0.31  1.08 -3.82 -0.13
C | -2.89 -2.89 -2.80 -2.30 -3.58  1.10 -1.26 -2.80  1.23
G | -3.58 -1.02 -2.63  1.62 -3.58 -2.89 -3.81  1.64 -1.61
T |  1.09  1.06 -0.19 -2.55  1.12 -3.20 -3.98 -1.82 -1.59
YAP1Macisaac et. alP = 4.68e-15View matrix ↘
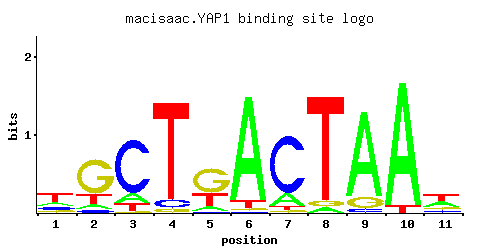
A | 0.185 0.073 0.126 0.001 0.105 0.908 0.166 0.043 0.849 0.940 0.334
C | 0.174 0.064 0.756 0.077 0.027 0.010 0.769 0.002 0.041 0.001 0.103
G | 0.142 0.679 0.013 0.037 0.569 0.018 0.023 0.049 0.109 0.001 0.150
T | 0.499 0.184 0.105 0.885 0.299 0.064 0.042 0.906 0.001 0.058 0.412
A |  18   7  12   0  10  90  16   4  84  94  33
C |  17   6  75   7   2   1  76   0   4   0  10
G |  14  67   1   3  56   1   2   4  10   0  15
T |  49  18  10  88  29   6   4  90   0   5  41
A | -0.55 -1.48 -0.93 -5.77 -1.11  1.04 -0.66 -2.01  0.98  1.08  0.04
C | -0.03 -1.03  1.44 -0.85 -1.90 -2.89  1.45 -4.50 -1.48 -5.19 -0.56
G | -0.24  1.33 -2.63 -1.58  1.15 -2.30 -2.06 -1.30 -0.50 -5.19 -0.18
T |  0.44 -0.55 -1.11  1.02 -0.07 -1.61 -2.03  1.04 -5.77 -1.71  0.25
YAP1Morozov et. al.P = 6.66e-15View matrix ↘
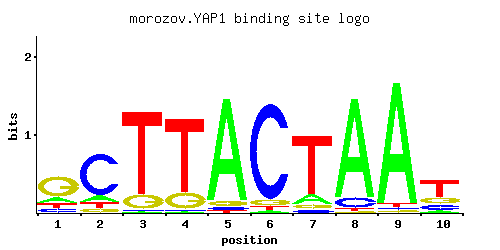
A | 0.140 0.113 0.010 0.008 0.908 0.022 0.118 0.890 0.947 0.066
C | 0.114 0.727 0.011 0.016 0.025 0.895 0.039 0.088 0.017 0.178
G | 0.611 0.065 0.142 0.172 0.048 0.060 0.060 0.007 0.012 0.197
T | 0.135 0.095 0.836 0.804 0.019 0.024 0.783 0.015 0.024 0.559
A |  14  11   1   0  90   2  11  89  94   6
C |  11  72   1   1   2  89   3   8   1  17
G |  61   6  14  17   4   6   6   0   1  19
T |  13   9  83  80   1   2  78   1   2  55
A | -0.83 -1.04 -3.47 -3.69  1.04 -2.68 -1.00  1.02  1.08 -1.58
C | -0.46  1.40 -2.80 -2.42 -1.97  1.60 -1.53 -0.72 -2.36 -0.01
G |  1.22 -1.02 -0.24 -0.05 -1.32 -1.10 -1.10 -3.25 -2.71  0.09
T | -0.86 -1.21  0.96  0.92 -2.82 -2.59  0.89 -3.06 -2.59  0.56
YAP1Zhu et. al.P = 3.79e-05View matrix ↘
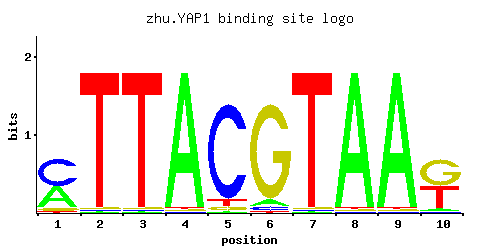
A | 0.40 0.01 0.01 0.97 0.01 0.06 0.01 0.97 0.97 0.04
C | 0.53 0.01 0.01 0.01 0.89 0.04 0.01 0.01 0.01 0.03
G | 0.05 0.01 0.01 0.01 0.04 0.89 0.01 0.01 0.01 0.52
T | 0.02 0.97 0.97 0.01 0.06 0.01 0.97 0.01 0.01 0.42
A |  40   1   1  97   1   6   1  97  97   4
C |  53   1   1   1  89   4   1   1   1   3
G |   5   1   1   1   4  89   1   1   1  52
T |   2  97  97   1   6   1  97   1   1  42
A |  0.22 -3.47 -3.47  1.11 -3.47 -1.67 -3.47  1.11  1.11 -2.08
C |  1.08 -2.89 -2.89 -2.89  1.60 -1.50 -2.89 -2.89 -2.89 -1.79
G | -1.28 -2.89 -2.89 -2.89 -1.50  1.60 -2.89 -2.89 -2.89  1.06
T | -2.77  1.11  1.11 -3.47 -1.67 -3.47  1.11 -3.47 -3.47  0.27
YAP1Zhao and StormoP = 1.13e-05View matrix ↘
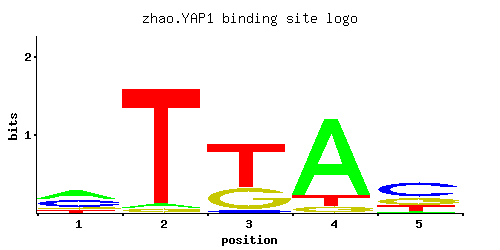
A | 0.183 0.106 0.641 0.930 0.107
C | 0.257 0.065 0.312 0.033 0.112
G | 0.513 0.001 0.044 0.001 0.353
T | 0.047 0.828 0.002 0.036 0.427
A |  18  10  64  93  10
C |  25   6  31   3  11
G |  51   0   4   0  35
T |   4  82   0   3  42
A | -0.56 -1.10  0.69  1.07 -1.10
C |  0.36 -1.02  0.55 -1.70 -0.47
G |  1.05 -5.19 -1.41 -5.19  0.67
T | -1.92  0.95 -5.08 -2.18  0.29
Gene-level annotations and interactions.
Genes bound in ChIP-chip experiments 156 genes
YAL003W, YAL005C, YAL037W, YBL018C, YBL032W, YBL033C, YBL087C, YBR068C, YBR190W, YBR191W, YBR200W, YCR028C, YDL013W, YDL017W, YDL018C, YDL020C, YDL133W, YDL170W, YDL171C, YDL179W, YDL182W, YDL183C, YDR010C, YDR011W, YDR013W, YDR059C, YDR060W, YDR132C, YDR164C, YDR165W, YDR224C, YDR225W, YDR259C, YDR261C, YDR307W, YDR308C, YDR316W-A, YDR316W-B, YDR500C, YDR501W, YDR533C, YEL042W, YEL044W, YEL045C, YEL046C, YER012W, YER044C, YER078C, YER079W, YER138C, YFL034W, YFL056C, YFL057C, YFR017C, YFR023W, YGL114W, YGL134W, YGL135W, YGL136C, YGL202W, YGR009C, YGR010W, YGR011W, YGR027C, YGR060W, YGR162W, YGR191W, YGR192C, YGR194C, YGR195W, YGR234W, YHR048W, YHR179W, YJL048C, YJL060W, YJL095W, YJL098W, YJL100W, YJL101C, YJL148W, YJR104C, YJR105W, YJR109C, YJR110W, YJR122W, YJR123W, YKL071W, YKL150W, YKL151C, YKR052C, YKR054C, YKR055W, YKR058W, YKR071C, YKR076W, YLL024C, YLL058W, YLL059C, YLL060C, YLL063C, YLR074C, YLR075W, YLR105C, YLR108C, YLR109W, YLR302C, YLR367W, YLR369W, YLR439W, YLR460C, YML028W, YML115C, YML116W, YML130C, YML131W, YMR037C, YMR038C, YMR144W, YMR231W, YNL025C, YNL087W, YNL134C, YNL231C, YNL238W, YNR018W, YNR061C, YOL034W, YOL115W, YOL117W, YOL118C, YOL119C, YOL123W, YOL124C, YOL151W, YOR018W, YOR043W, YOR044W, YOR074C, YOR075W, YOR128C, YOR162C, YOR163W, YOR180C, YOR181W, YOR236W, YOR273C, YOR274W, YOR315W, YOR335C, YOR336W, YPL044C, YPL111W, YPL216W, YPL217C, YPR002C-A, YPR065W
Genes affected by TF deletion 56 genes
YOR225W, YDR135C, YOR226C, YPL016W, YMR105C, YNL111C, YML058W-A, YNL339C, YCR107W, YLR155C, YLR157C, YML028W, YGR296W, YMR173W, YMR023C, YNR066C, YLR099C, YJL026W, YOL150C, YLR160C, YPR065W, YGR294W, YJL101C, YKL096W, YLR108C, YNR076W, YKL120W, YLR109W, YMR173W-A, YGR019W, YDR353W, YHR219W, YDR481C, YJR162C, YOL119C, YOL151W, YDR297W, YER039C, YER067W, YER044C, YJR104C, YGL255W, YMR034C, YMR038C, YOL067C, YBR244W, YHR135C, YBR085W, YHR046C, YKL008C, YKL010C, YLR178C, YFL068W, YNL134C, YOR306C, YGR209C
Genes supported by both experiments 11 genes
YER044C, YJL101C, YJR104C, YLR108C, YLR109W, YML028W, YMR038C, YNL134C, YOL119C, YOL151W, YPR065W