XBP1
YIL101C
Transcriptional repressor that binds to promoter sequences of the cyclin genes, CYS3, and SMF2; expression is induced by stress or starvation during mitosis, and late in meiosis; member of the Swi4p/Mbp1p family; potential Cdc28p substrate
Best-performing DNA-binding model.
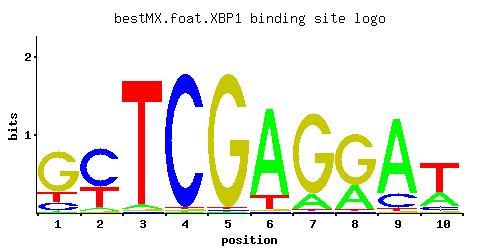
View and copy the recommended matrices ↘
A | 0.01 0.05 0.03 0.01 0.01 0.85 0.15 0.30 0.81 0.29
C | 0.14 0.63 0.01 0.97 0.01 0.01 0.01 0.01 0.16 0.08
G | 0.69 0.01 0.01 0.01 0.97 0.01 0.83 0.68 0.01 0.03
T | 0.16 0.31 0.95 0.01 0.01 0.13 0.01 0.01 0.02 0.60
A |   1   5   3   1   1  85  15  30  81  28
C |  14  63   1  97   1   1   1   1  16   8
G |  69   1   1   1  97   1  83  68   1   3
T |  16  31  95   1   1  13   1   1   2  60
A | -3.47 -1.86 -2.37 -3.47 -3.47  0.98 -0.76 -0.06  0.93 -0.10
C | -0.25  1.25 -2.89  1.68 -2.89 -2.89 -2.89 -2.89 -0.12 -0.81
G |  1.34 -2.89 -2.89 -2.89  1.68 -2.89  1.53  1.33 -2.89 -1.79
T | -0.69 -0.03  1.09 -3.47 -3.47 -0.90 -3.47 -3.47 -2.77  0.63
Alternative candidate matrices 7
Historical matrix candidates from the original ScerTF database. Expand a source to inspect its original logo, scores, and matrix values.
XBP1Badis et. al.P = 4.08e-09View matrix ↘
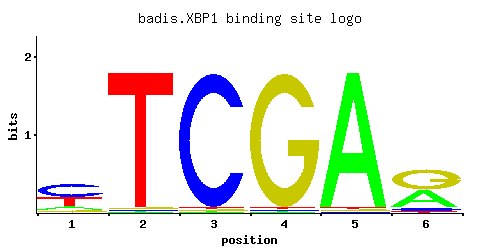
A | 0.12 0.01 0.01 0.01 0.97 0.40
C | 0.50 0.01 0.97 0.01 0.01 0.08
G | 0.07 0.01 0.01 0.97 0.01 0.50
T | 0.31 0.97 0.01 0.01 0.01 0.03
A |  12   1   1   1  97  40
C |  50   1  97   1   1   8
G |   7   1   1  97   1  50
T |  31  97   1   1   1   3
A | -0.98 -3.47 -3.47 -3.47  1.11  0.22
C |  1.02 -2.89  1.68 -2.89 -2.89 -0.81
G | -0.94 -2.89 -2.89  1.68 -2.89  1.02
T | -0.03  1.11 -3.47 -3.47 -3.47 -2.37
XBP1_BFoat et. al.P = 0.08952View matrix ↘
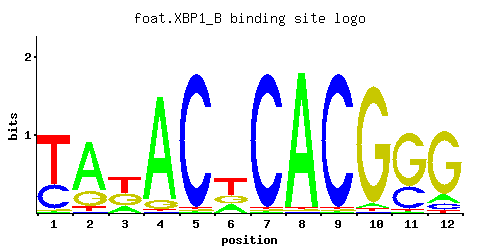
A | 0.01 0.71 0.19 0.90 0.01 0.25 0.01 0.97 0.01 0.03 0.01 0.10
C | 0.33 0.01 0.01 0.01 0.97 0.01 0.97 0.01 0.97 0.01 0.29 0.08
G | 0.01 0.22 0.36 0.08 0.01 0.26 0.01 0.01 0.01 0.93 0.70 0.80
T | 0.66 0.06 0.45 0.01 0.01 0.48 0.01 0.01 0.01 0.02 0.01 0.02
A |   1  71  19  90   1  25   1  97   1   3   1  10
C |  33   1   1   1  97   1  97   1  97   1  28   8
G |   1  22  36   8   1  26   1   1   1  93  70  80
T |  66   6  45   1   1  48   1   1   1   2   1   2
A | -3.47  0.80 -0.52  1.03 -3.47 -0.25 -3.47  1.11 -3.47 -2.37 -3.47 -1.16
C |  0.61 -2.89 -2.89 -2.89  1.68 -2.89  1.68 -2.89  1.68 -2.89  0.48 -0.81
G | -2.89  0.20  0.69 -0.81 -2.89  0.37 -2.89 -2.89 -2.89  1.64  1.36  1.49
T |  0.72 -1.67  0.34 -3.47 -3.47  0.41 -3.47 -3.47 -3.47 -2.77 -3.47 -2.77
XBP1Harbison et. al.P = 2.57e-08View matrix ↘
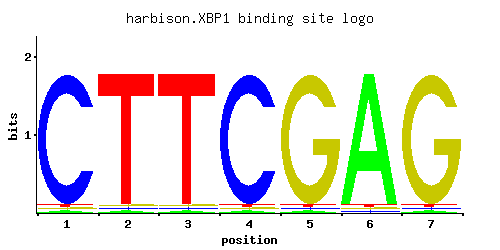
A | 0.012 0.012 0.012 0.012 0.012 0.965 0.012
C | 0.965 0.012 0.012 0.965 0.012 0.012 0.012
G | 0.012 0.012 0.012 0.012 0.965 0.012 0.965
T | 0.012 0.965 0.965 0.012 0.012 0.012 0.012
A |   1   1   1   1   1  96   1
C |  96   1   1  96   1   1   1
G |   1   1   1   1  96   1  96
T |   1  96  96   1   1   1   1
A | -3.28 -3.28 -3.28 -3.28 -3.28  1.10 -3.28
C |  1.68 -2.71 -2.71  1.68 -2.71 -2.71 -2.71
G | -2.71 -2.71 -2.71 -2.71  1.68 -2.71  1.68
T | -3.28  1.10  1.10 -3.28 -3.28 -3.28 -3.28
XBP1Macisaac et. alP = 1.30e-10View matrix ↘
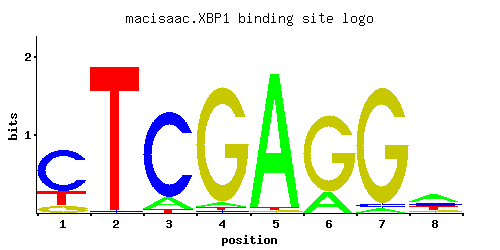
A | 0.001 0.001 0.113 0.032 0.967 0.210 0.032 0.484
C | 0.676 0.016 0.854 0.016 0.001 0.001 0.032 0.210
G | 0.113 0.001 0.001 0.936 0.016 0.788 0.935 0.129
T | 0.210 0.982 0.032 0.016 0.016 0.001 0.001 0.177
A |   0   0  11   3  96  21   3  48
C |  67   1  85   1   0   0   3  21
G |  11   0   0  93   1  78  93  12
T |  21  98   3   1   1   0   0  17
A | -5.77 -5.77 -1.04 -2.30  1.11 -0.42 -2.30  0.41
C |  1.32 -2.42  1.56 -2.42 -5.19 -5.19 -1.73  0.15
G | -0.47 -5.19 -5.19  1.65 -2.42  1.48  1.65 -0.33
T | -0.42  1.12 -2.30 -3.00 -3.00 -5.77 -5.77 -0.59
XBP1Zhu J and MQ ZhangP = 6.03e-08View matrix ↘
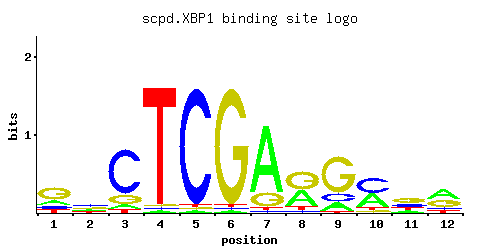
A | 0.20 0.20 0.07 0.02 0.02 0.02 0.78 0.39 0.15 0.39 0.15 0.44
C | 0.15 0.39 0.73 0.02 0.93 0.02 0.02 0.05 0.15 0.46 0.24 0.12
G | 0.54 0.24 0.15 0.02 0.02 0.93 0.17 0.49 0.68 0.07 0.44 0.34
T | 0.12 0.17 0.05 0.93 0.02 0.02 0.02 0.07 0.02 0.07 0.17 0.10
A |  20  20   7   2   2   2  78  39  15  39  15  44
C |  15  39  73   2  93   2   2   5  15  46  24  12
G |  54  24  15   2   2  93  17  49  68   7  44  34
T |  12  17   5  93   2   2   2   7   2   7  17  10
A | -0.47 -0.47 -1.52 -2.77 -2.77 -2.77  0.89  0.20 -0.76  0.20 -0.76  0.32
C | -0.18  0.77  1.40 -2.20  1.64 -2.20 -2.20 -1.28 -0.18  0.94  0.29 -0.41
G |  1.10  0.29 -0.18 -2.20 -2.20  1.64 -0.06  1.00  1.33 -0.94  0.89  0.64
T | -0.98 -0.63 -1.86  1.07 -2.77 -2.77 -2.77 -1.52 -2.77 -1.52 -0.63 -1.16
XBP1Zhu et. al.P = 6.41e-12View matrix ↘
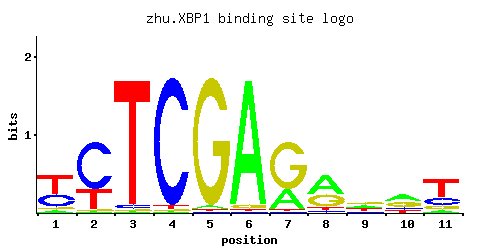
A | 0.07 0.02 0.01 0.01 0.02 0.95 0.28 0.52 0.27 0.42 0.08
C | 0.34 0.68 0.03 0.96 0.01 0.01 0.02 0.07 0.13 0.16 0.23
G | 0.07 0.02 0.01 0.01 0.96 0.03 0.68 0.34 0.36 0.32 0.12
T | 0.52 0.28 0.95 0.02 0.01 0.01 0.02 0.07 0.24 0.10 0.57
A |   7   2   1   1   2  95  28  52  27  42   8
C |  34  68   3  96   1   1   2   7  13  16  23
G |   7   2   1   1  96   3  68  34  36  32  12
T |  52  28  95   2   1   1   2   7  24  10  56
A | -1.52 -2.77 -3.47 -3.47 -2.77  1.09 -0.13  0.49 -0.17  0.27 -1.39
C |  0.64  1.33 -1.79  1.67 -2.89 -2.89 -2.20 -0.94 -0.33 -0.12  0.25
G | -0.94 -2.20 -2.89 -2.89  1.67 -1.79  1.33  0.64  0.69  0.58 -0.41
T |  0.49 -0.13  1.09 -2.77 -3.47 -3.47 -2.77 -1.52 -0.29 -1.16  0.58
XBP1Zhao and StormoP = 6.47e-08View matrix ↘
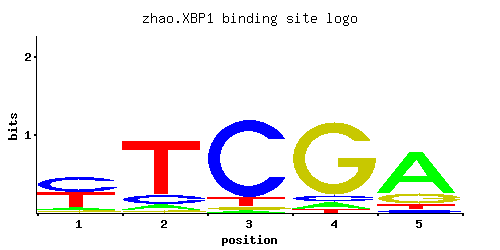
A | 0.071 0.066 0.026 0.066 0.708
C | 0.453 0.136 0.847 0.068 0.045
G | 0.062 0.036 0.035 0.836 0.175
T | 0.414 0.761 0.092 0.030 0.072
A |   7   6   2   6  70
C |  45  13  84   6   4
G |   6   3   3  83  17
T |  41  76   9   3   7
A | -1.51 -1.58 -2.51 -1.58  0.79
C |  0.92 -0.28  1.55 -0.97 -1.39
G | -1.07 -1.61 -1.64  1.54 -0.03
T |  0.26  0.87 -1.25 -2.37 -1.49
Gene-level annotations and interactions.
Genes bound in ChIP-chip experiments 25 genes
YAL009W, YAL010C, YAL011W, YAR010C, YBL027W, YBL028C, YBR127C, YDL215C, YDR019C, YDR451C, YDR452W, YFR016C, YHR051W, YHR193C, YHR194W, YIL018W, YIR017C, YIR018W, YJL045W, YJL112W, YLL037W, YLL039C, YLR143W, YMR183C, YMR184W
Genes affected by TF deletion 41 genes
YKL111C, YLR025W, YLR436C, YNL211C, YPL017C, YPL049C, YNL019C, YPL016W, YPR109W, YHR085W, YIR034C, YBR093C, YFR006W, YDR281C, YLR119W, YJR148W, YLR099C, YPL058C, YBR291C, YBR046C, YNL065W, YKL090W, YPL066W, YPL063W, YHR097C, YKL001C, YPL162C, YHR068W, YPL095C, YFL008W, YMR034C, YOR212W, YHR135C, YHR140W, YLR113W, YNL296W, YOL160W, YDL216C, YDR485C, YNR050C, YNL328C
Predicted TF–TF partners 3 genes
HSF1, MOT2, STB3