USV1
YPL230W, NSF1
Putative transcription factor containing a C2H2 zinc finger; mutation affects transcriptional regulation of genes involved in growth on non-fermentable carbon sources, response to salt stress and cell wall biosynthesis
Best-performing DNA-binding model.
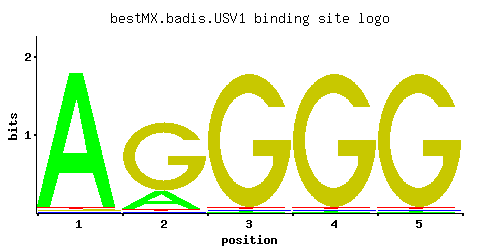
View and copy the recommended matrices ↘
A | 0.97 0.20 0.01 0.01 0.01
C | 0.01 0.01 0.01 0.01 0.01
G | 0.01 0.78 0.97 0.97 0.97
T | 0.01 0.01 0.01 0.01 0.01
A |  97  20   1   1   1
C |   1   1   1   1   1
G |   1  78  97  97  97
T |   1   1   1   1   1
A |  1.11 -0.47 -3.47 -3.47 -3.47
C | -2.89 -2.89 -2.89 -2.89 -2.89
G | -2.89  1.47  1.68  1.68  1.68
T | -3.47 -3.47 -3.47 -3.47 -3.47
Alternative candidate matrices 3
Historical matrix candidates from the original ScerTF database. Expand a source to inspect its original logo, scores, and matrix values.
USV1Foat et. al.P = 1View matrix ↘
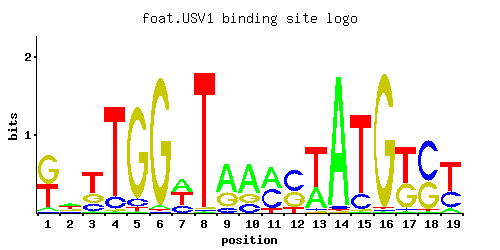
A | 0.05 0.35 0.02 0.01 0.01 0.02 0.39 0.01 0.58 0.61 0.47 0.01 0.32 0.96 0.01 0.01 0.01 0.01 0.09
C | 0.01 0.15 0.18 0.12 0.08 0.01 0.22 0.01 0.11 0.19 0.43 0.51 0.03 0.02 0.16 0.01 0.03 0.59 0.33
G | 0.53 0.19 0.25 0.01 0.88 0.96 0.01 0.01 0.31 0.19 0.01 0.37 0.02 0.01 0.01 0.97 0.39 0.40 0.01
T | 0.41 0.32 0.55 0.86 0.03 0.01 0.38 0.97 0.01 0.01 0.10 0.12 0.63 0.01 0.82 0.01 0.58 0.01 0.57
A |   5  35   2   1   1   2  39   1  57  61  47   1  32  96   1   1   1   1   9
C |   1  15  18  12   8   1  22   1  11  19  43  51   3   2  16   1   3  59  33
G |  53  19  25   1  88  96   1   1  31  19   1  37   2   1   1  97  39  40   1
T |  41  32  55  86   3   1  38  97   1   1  10  12  63   1  82   1  57   1  56
A | -1.86  0.09 -2.77 -3.47 -3.47 -2.77  0.20 -3.47  0.59  0.65  0.38 -3.47  0.00  1.10 -3.47 -3.47 -3.47 -3.47 -1.27
C | -2.89 -0.18  0.00 -0.41 -0.81 -2.89  0.20 -2.89 -0.49  0.05  0.87  1.04 -1.79 -2.20 -0.12 -2.89 -1.79  1.19  0.61
G |  1.08  0.05  0.33 -2.89  1.59  1.67 -2.89 -2.89  0.54  0.05 -2.89  0.72 -2.20 -2.89 -2.89  1.68  0.77  0.80 -2.89
T |  0.25  0.00  0.54  0.99 -2.37 -3.47  0.17  1.11 -3.47 -3.47 -1.16 -0.98  0.68 -3.47  0.94 -3.47  0.59 -3.47  0.58
USV1Zhu et. al.P = 1View matrix ↘
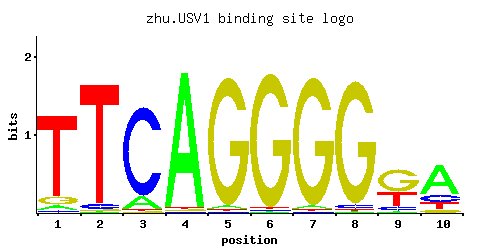
A | 0.13 0.32 0.01 0.01 0.01 0.01 0.01 0.01 0.94 0.85
C | 0.06 0.55 0.95 0.96 0.97 0.96 0.01 0.01 0.01 0.09
G | 0.16 0.10 0.03 0.01 0.01 0.01 0.01 0.86 0.04 0.02
T | 0.65 0.03 0.01 0.02 0.01 0.02 0.97 0.12 0.01 0.04
A |  13  32   1   1   1   1   1   1  94  85
C |   6  55  95  96  97  96   1   1   1   9
G |  16  10   3   1   1   1   1  86   4   2
T |  65   3   1   2   1   2  97  12   1   4
A | -0.90  0.00 -3.47 -3.47 -3.47 -3.47 -3.47 -3.47  1.08  0.98
C | -1.10  1.12  1.66  1.67  1.68  1.67 -2.89 -2.89 -2.89 -0.69
G | -0.12 -0.59 -1.79 -2.89 -2.89 -2.89 -2.89  1.56 -1.50 -2.20
T |  0.71 -2.37 -3.47 -2.77 -3.47 -2.77  1.11 -0.98 -3.47 -2.08
USV1Zhao and StormoP = 0.4113View matrix ↘
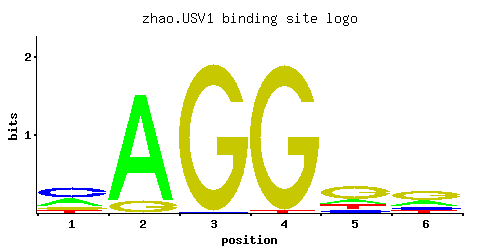
A | 0.090 0.157 0.013 0.001 0.001 0.097
C | 0.489 0.549 0.985 0.989 0.101 0.118
G | 0.180 0.110 0.001 0.009 0.003 0.481
T | 0.241 0.184 0.001 0.001 0.895 0.304
A |   9  15   1   0   0   9
C |  48  54  98  98  10  11
G |  18  11   0   0   0  48
T |  24  18   0   0  89  30
A | -1.27 -0.71 -3.20 -5.77 -5.77 -1.19
C |  1.00  1.12  1.70  1.70 -0.58 -0.42
G |  0.00 -0.49 -5.19 -3.00 -4.09  0.98
T | -0.28 -0.55 -5.77 -5.77  1.03 -0.05
Gene-level annotations and interactions.
Genes bound in ChIP-chip experiments 52 genes
YAL001C, YAL058W, YAR070C, YAR071W, YBL059W, YBR159W, YBR239C, YCL051W, YCL052C, YDL051W, YDL052C, YDL105W, YDL106C, YDR113C, YDR115W, YDR328C, YDR503C, YER172C, YER173W, YFL034W, YFR023W, YFR044C, YFR045W, YGL164C, YGL165C, YGL205W, YGL206C, YGR166W, YHL009C, YHR114W, YIL111W, YIR024C, YIR025W, YJL033W, YJL193W, YJL195C, YJR041C, YJR042W, YKL168C, YKL175W, YKL176C, YLR022C, YLR166C, YLR167W, YLR263W, YNL010W, YNL011C, YNL310C, YNR068C, YPL186C, YPL266W, YPR004C
Genes affected by TF deletion 1 genes
No Data
Predicted TF–TF partners 18 genes
GSM1, MIG1, MIG2, MIG3, NHP10, NRG1, OAF1, PHD1, RDS2, RPH1, RSC3, RSF2, SKN7, SOK2, STP1, SUT1, YDR026C, YER184C