TBS1
YBR150C
Putative protein of unknown function; the authentic, non-tagged protein is detected in highly purified mitochondria in high-throughput studies
Best-performing DNA-binding model.
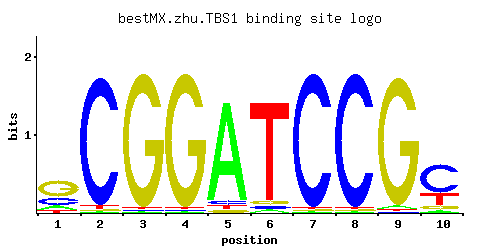
View and copy the recommended matrices ↘
A | 0.14 0.01 0.01 0.01 0.90 0.03 0.01 0.01 0.02 0.04
C | 0.23 0.96 0.01 0.01 0.04 0.03 0.97 0.97 0.01 0.63
G | 0.55 0.01 0.97 0.97 0.03 0.04 0.01 0.01 0.96 0.09
T | 0.07 0.02 0.01 0.01 0.03 0.90 0.01 0.01 0.01 0.25
A |  14   1   1   1  90   3   1   1   2   4
C |  23  96   1   1   4   3  97  97   1  63
G |  55   1  97  97   3   4   1   1  96   9
T |   7   2   1   1   3  90   1   1   1  25
A | -0.83 -3.47 -3.47 -3.47  1.03 -2.37 -3.47 -3.47 -2.77 -2.08
C |  0.25  1.67 -2.89 -2.89 -1.50 -1.79  1.68  1.68 -2.89  1.25
G |  1.12 -2.89  1.68  1.68 -1.79 -1.50 -2.89 -2.89  1.67 -0.69
T | -1.52 -2.77 -3.47 -3.47 -2.37  1.03 -3.47 -3.47 -3.47 -0.25
Alternative candidate matrices 3
Historical matrix candidates from the original ScerTF database. Expand a source to inspect its original logo, scores, and matrix values.
TBS1Badis et. al.P = 2.59e-08View matrix ↘
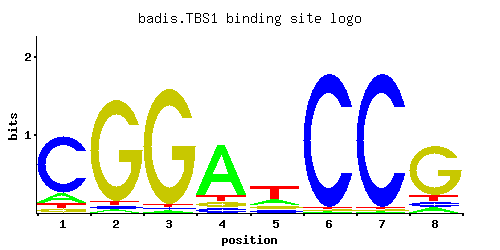
A | 0.12 0.03 0.02 0.76 0.20 0.01 0.01 0.08
C | 0.78 0.03 0.02 0.08 0.13 0.97 0.97 0.08
G | 0.05 0.91 0.94 0.08 0.13 0.01 0.01 0.76
T | 0.05 0.03 0.02 0.08 0.54 0.01 0.01 0.08
A |  12   3   2  76  20   1   1   8
C |  78   3   2   8  13  97  97   8
G |   5  91  94   8  13   1   1  76
T |   5   3   2   8  54   1   1   8
A | -0.98 -2.37 -2.77  0.86 -0.47 -3.47 -3.47 -1.39
C |  1.47 -1.79 -2.20 -0.81 -0.33  1.68  1.68 -0.81
G | -1.28  1.62  1.65 -0.81 -0.33 -2.89 -2.89  1.44
T | -1.86 -2.37 -2.77 -1.39  0.52 -3.47 -3.47 -1.39
TBS1Foat et. al.P = 1View matrix ↘
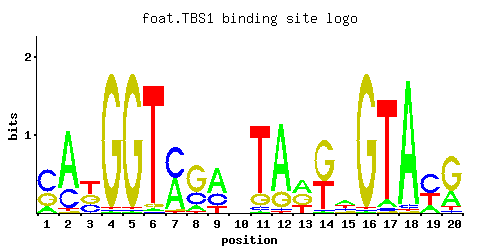
A | 0.14 0.73 0.01 0.01 0.01 0.02 0.47 0.12 0.57 0.27 0.01 0.78 0.40 0.01 0.41 0.01 0.06 0.96 0.18 0.26
C | 0.53 0.24 0.27 0.01 0.01 0.01 0.50 0.26 0.29 0.19 0.05 0.02 0.01 0.01 0.19 0.01 0.03 0.03 0.52 0.03
G | 0.32 0.01 0.31 0.97 0.97 0.03 0.02 0.60 0.01 0.28 0.14 0.19 0.36 0.59 0.14 0.97 0.01 0.01 0.01 0.65
T | 0.01 0.02 0.41 0.01 0.01 0.94 0.01 0.02 0.14 0.26 0.80 0.01 0.23 0.39 0.26 0.01 0.90 0.01 0.29 0.06
A |  14  73   1   1   1   2  47  12  56  27   1  78  40   1  41   1   6  96  18  26
C |  53  24  27   1   1   1  50  26  28  19   5   2   1   1  19   1   3   3  52   3
G |  32   1  31  97  97   3   2  60   1  28  14  19  36  59  14  97   1   1   1  65
T |   1   2  41   1   1  94   1   2  14  26  80   1  23  39  26   1  90   1  28   6
A | -0.83  0.82 -3.47 -3.47 -3.47 -2.77  0.38 -0.98  0.58 -0.17 -3.47  0.89  0.22 -3.47  0.25 -3.47 -1.67  1.10 -0.58 -0.21
C |  1.08  0.29  0.41 -2.89 -2.89 -2.89  1.02  0.37  0.48  0.05 -1.28 -2.20 -2.89 -2.89  0.05 -2.89 -1.79 -1.79  1.06 -1.79
G |  0.58 -2.89  0.54  1.68  1.68 -1.79 -2.20  1.20 -2.89  0.44 -0.25  0.05  0.69  1.19 -0.25  1.68 -2.89 -2.89 -2.89  1.28
T | -3.47 -2.77  0.25 -3.47 -3.47  1.08 -3.47 -2.77 -0.83 -0.21  0.92 -3.47 -0.33  0.20 -0.21 -3.47  1.03 -3.47 -0.10 -1.67
TBS1Zhao and StormoP = 1.50e-05View matrix ↘
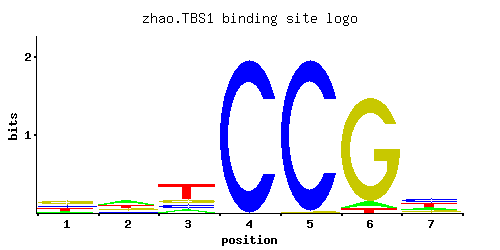
A | 0.141 0.418 0.113 0.001 0.001 0.054 0.145
C | 0.237 0.135 0.150 0.997 0.994 0.001 0.401
G | 0.415 0.194 0.180 0.001 0.004 0.908 0.142
T | 0.206 0.254 0.557 0.001 0.001 0.038 0.312
A |  14  41  11   0   0   5  14
C |  23  13  15  99  99   0  40
G |  41  19  18   0   0  90  14
T |  20  25  55   0   0   3  31
A | -0.82  0.27 -1.04 -5.77 -5.77 -1.78 -0.79
C |  0.28 -0.29 -0.18  1.71  1.71 -5.19  0.80
G |  0.84  0.07  0.00 -5.19 -3.81  1.62 -0.24
T | -0.44 -0.23  0.55 -5.77 -5.77 -2.13 -0.03
Gene-level annotations and interactions.
Genes bound in ChIP-chip experiments 18 genes
YBR009C, YBR010W, YBR109C, YBR110W, YCR028C, YDR278C, YDR279W, YDR370C, YDR371W, YER044C, YGR106C, YHL012W, YHL013C, YKL062W, YKL072W, YLR011W, YML005W, YPR142C
Genes affected by TF deletion 50 genes
YIL112W, YOL047C, YDL131W, YLR279W, YLR460C, YPL016W, YPR081C, YLR184W, YML089C, YPL148C, YIR027C, YMR136W, YNL180C, YOR235W, YOR009W, YIL087C, YER001W, YGL018C, YOR008C-A, YOR072W, YOL084W, YJL217W, YFL014W, YMR319C, YKR093W, YOL058W, YOR273C, YDR210W, YKL062W, YKL096W, YLR108C, YDR209C, YKL120W, YNL195C, YNL160W, YOL119C, YFR056C, YER163C, YMR034C, YEL037C, YFR055W, YGL032C, YHR137W, YKL096W-A, YOR024W, YDR122W, YCR102C, YLR395C, YNL134C, YPL165C
Genes supported by both experiments 1 genes
YKL062W