STP4
YDL048C
Protein containing a Kruppel-type zinc-finger domain; has similarity to Stp1p, Stp2p, and Stp3p
Best-performing DNA-binding model.
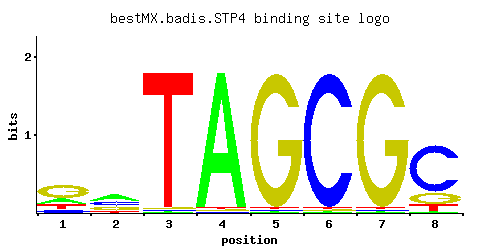
View and copy the recommended matrices ↘
A | 0.19 0.40 0.01 0.97 0.01 0.01 0.01 0.01
C | 0.11 0.29 0.01 0.01 0.01 0.97 0.01 0.72
G | 0.55 0.24 0.01 0.01 0.97 0.01 0.97 0.17
T | 0.15 0.07 0.97 0.01 0.01 0.01 0.01 0.10
A |  19  40   1  97   1   1   1   1
C |  11  28   1   1   1  97   1  72
G |  55  24   1   1  97   1  97  17
T |  15   7  97   1   1   1   1  10
A | -0.52  0.22 -3.47  1.11 -3.47 -3.47 -3.47 -3.47
C | -0.49  0.48 -2.89 -2.89 -2.89  1.68 -2.89  1.39
G |  1.12  0.29 -2.89 -2.89  1.68 -2.89  1.68 -0.06
T | -0.76 -1.52  1.11 -3.47 -3.47 -3.47 -3.47 -1.16
Alternative candidate matrices 4
Historical matrix candidates from the original ScerTF database. Expand a source to inspect its original logo, scores, and matrix values.
STP4Foat et. al.P = 0.009335View matrix ↘
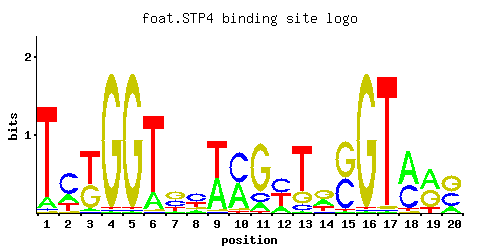
A | 0.10 0.22 0.04 0.01 0.01 0.17 0.07 0.14 0.45 0.42 0.12 0.19 0.01 0.29 0.01 0.01 0.01 0.55 0.46 0.17
C | 0.02 0.57 0.01 0.01 0.01 0.01 0.34 0.49 0.01 0.53 0.14 0.43 0.09 0.05 0.45 0.01 0.01 0.41 0.01 0.38
G | 0.01 0.02 0.40 0.97 0.97 0.01 0.42 0.15 0.01 0.04 0.73 0.01 0.20 0.43 0.54 0.97 0.02 0.01 0.42 0.45
T | 0.87 0.20 0.55 0.01 0.01 0.81 0.17 0.23 0.54 0.01 0.01 0.37 0.71 0.22 0.01 0.01 0.97 0.04 0.12 0.01
A |  10  22   4   1   1  17   7  14  45  42  12  19   1  28   1   1   1  55  46  17
C |   2  56   1   1   1   1  34  49   1  53  14  43   9   5  45   1   1  41   1  38
G |   1   2  40  97  97   1  42  15   1   4  73   1  20  43  54  97   2   1  42  45
T |  87  20  55   1   1  81  17  23  54   1   1  37  71  22   1   1  97   4  12   1
A | -1.16 -0.37 -2.08 -3.47 -3.47 -0.63 -1.52 -0.83  0.34  0.27 -0.98 -0.52 -3.47 -0.10 -3.47 -3.47 -3.47  0.54  0.36 -0.63
C | -2.20  1.15 -2.89 -2.89 -2.89 -2.89  0.64  1.00 -2.89  1.08 -0.25  0.87 -0.69 -1.28  0.92 -2.89 -2.89  0.82 -2.89  0.75
G | -2.89 -2.20  0.80  1.68  1.68 -2.89  0.85 -0.18 -2.89 -1.50  1.40 -2.89  0.11  0.87  1.10  1.68 -2.20 -2.89  0.85  0.92
T |  1.00 -0.47  0.54 -3.47 -3.47  0.93 -0.63 -0.33  0.52 -3.47 -3.47  0.15  0.80 -0.37 -3.47 -3.47  1.11 -2.08 -0.98 -3.47
STP4Macisaac et. alP = 6.63e-09View matrix ↘
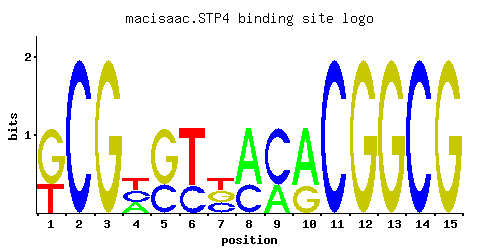
A | 0.001 0.001 0.001 0.001 0.001 0.001 0.001 0.001 0.335 0.670 0.001 0.336 0.001 0.001 0.335
C | 0.997 0.001 0.997 0.997 0.001 0.328 0.001 0.001 0.335 0.001 0.663 0.001 0.997 0.001 0.663
G | 0.001 0.997 0.001 0.001 0.997 0.001 0.671 0.335 0.328 0.328 0.335 0.336 0.001 0.997 0.001
T | 0.001 0.001 0.001 0.001 0.001 0.670 0.327 0.663 0.001 0.001 0.001 0.328 0.001 0.001 0.001
A |   0   0   0   0   0   0   0   0  33  67   0  33   0   0  33
C |  99   0  99  99   0  32   0   0  33   0  66   0  99   0  66
G |   0  99   0   0  99   0  67  33  32  32  33  33   0  99   0
T |   0   0   0   0   0  67  32  66   0   0   0  32   0   0   0
A | -5.77 -5.77 -5.77 -5.77 -5.77 -5.77 -5.77 -5.77  0.05  0.74 -5.77  0.05 -5.77 -5.77  0.05
C |  1.71 -5.19  1.71  1.71 -5.19  0.60 -5.19 -5.19  0.62 -5.19  1.30 -5.19  1.71 -5.19  1.30
G | -5.19  1.71 -5.19 -5.19  1.71 -5.19  1.32  0.62  0.60  0.60  0.62  0.62 -5.19  1.71 -5.19
T | -5.77 -5.77 -5.77 -5.77 -5.77  0.74  0.02  0.73 -5.77 -5.77 -5.77  0.02 -5.77 -5.77 -5.77
STP4Zhu et. al.P = 2.66e-06View matrix ↘
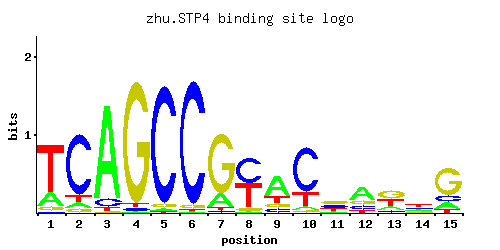
A | 0.07 0.36 0.31 0.11 0.22 0.21 0.18 0.44 0.03 0.01 0.01 0.02 0.03 0.08 0.71
C | 0.65 0.16 0.45 0.18 0.35 0.03 0.11 0.06 0.78 0.03 0.03 0.95 0.01 0.05 0.06
G | 0.14 0.27 0.09 0.17 0.31 0.70 0.11 0.49 0.03 0.95 0.95 0.02 0.08 0.80 0.02
T | 0.14 0.20 0.15 0.53 0.11 0.05 0.60 0.01 0.17 0.01 0.02 0.01 0.88 0.07 0.20
A |   7  36  31  11  22  21  18  44   3   1   1   2   3   8  71
C |  65  16  45  18  35   3  11   6  78   3   3  95   1   5   6
G |  14  27   9  17  31  70  11  49   3  95  95   2   8  80   2
T |  14  20  15  53  11   5  60   1  17   1   2   1  88   7  20
A | -1.52  0.12 -0.03 -1.07 -0.37 -0.42 -0.58  0.32 -2.37 -3.47 -3.47 -2.77 -2.37 -1.39  0.80
C |  1.28 -0.12  0.92  0.00  0.66 -1.79 -0.49 -1.10  1.47 -1.79 -1.79  1.66 -2.89 -1.28 -1.10
G | -0.25  0.41 -0.69 -0.06  0.54  1.36 -0.49  1.00 -1.79  1.66  1.66 -2.20 -0.81  1.49 -2.20
T | -0.83 -0.47 -0.76  0.50 -1.07 -1.86  0.63 -3.47 -0.63 -3.47 -2.77 -3.47  1.01 -1.52 -0.47
STP4Zhao and StormoP = 1View matrix ↘
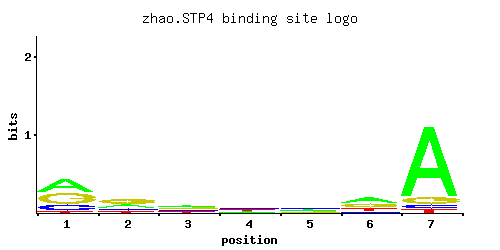
A | 0.412 0.257 0.355 0.233 0.283 0.426 0.823
C | 0.193 0.200 0.218 0.325 0.292 0.105 0.047
G | 0.376 0.428 0.220 0.184 0.259 0.280 0.089
T | 0.019 0.114 0.207 0.258 0.167 0.189 0.041
A |  41  25  35  23  28  42  82
C |  19  20  21  32  29  10   4
G |  37  42  22  18  25  28   8
T |   1  11  20  25  16  18   4
A |  0.25 -0.22  0.10 -0.32 -0.12  0.29  0.94
C |  0.07  0.11  0.19  0.59  0.48 -0.54 -1.34
G |  0.74  0.87  0.20  0.02  0.36  0.44 -0.70
T | -2.82 -1.03 -0.44 -0.22 -0.65 -0.53 -2.05
Gene-level annotations and interactions.
Genes bound in ChIP-chip experiments 53 genes
YAL040C, YAL063C, YBR083W, YCR018C-A, YCR019W, YDR278C, YDR495C, YDR543C, YDR544C, YDR545W, YER002W, YER011W, YER124C, YER125W, YER189W, YER190W, YGL071W, YGL072C, YGL074C, YGL258W, YHR160C, YIL159W, YIL160C, YIR020C, YJL148W, YJL184W, YJL185C, YKL131W, YKL133C, YKR009C, YKR097W, YLR008C, YLR009W, YLR135W, YLR463C, YLR465C, YLR467W, YMR011W, YMR017W, YMR018W, YMR193W, YNL337W, YOL084W, YOL085C, YOR019W, YOR032C, YOR058C, YOR236W, YOR327C, YOR328W, YPL141C, YPL230W, YPR184W
Genes affected by TF deletion 59 genes
YDR222W, YDR034C-A, YDR365W-B, YGR122C-A, YHR145C, YOR038C, YPL014W, YLR374C, YMR103C, YGR250C, YML027W, YMR104C, YMR136W, YDR340W, YLR121C, YHR192W, YCR021C, YOL051W, YDL072C, YKL051W, YCR018C-A, YMR023C, YNL055C, YNR066C, YJR148W, YOR384W, YMR145C, YIL060W, YIR035C, YLR375W, YMR144W, YNL182C, YOL083W, YPL273W, YER064C, YPL087W, YOL002C, YOR273C, YGR138C, YLR414C, YOR019W, YNL033W, YGR139W, YHR068W, YNL160W, YPR002C-A, YBR054W, YLR297W, YDR055W, YER138W-A, YMR034C, YPL257W-B, YHR135C, YMR181C, YMR211W, YMR250W, YOR092W, YER050C, YNR019W
Genes supported by both experiments 2 genes
YCR018C-A, YOR019W