STP2
YHR006W
Transcription factor, activated by proteolytic processing in response to signals from the SPS sensor system for external amino acids; activates transcription of amino acid permease genes
Best-performing DNA-binding model.
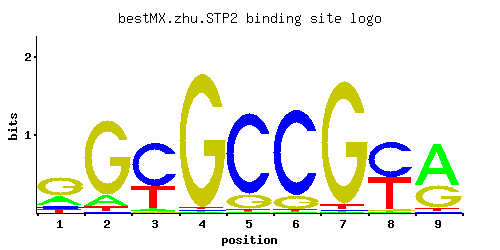
View and copy the recommended matrices ↘
A | 0.24 0.11 0.03 0.01 0.01 0.01 0.01 0.01 0.62
C | 0.11 0.01 0.64 0.01 0.83 0.85 0.01 0.52 0.01
G | 0.57 0.83 0.01 0.97 0.15 0.13 0.95 0.01 0.34
T | 0.08 0.05 0.31 0.01 0.01 0.01 0.03 0.46 0.03
A |  24  11   3   1   1   1   1   1  62
C |  11   1  64   1  83  85   1  52   1
G |  56  83   1  97  15  13  95   1  34
T |   8   5  31   1   1   1   3  46   3
A | -0.29 -1.07 -2.37 -3.47 -3.47 -3.47 -3.47 -3.47  0.66
C | -0.49 -2.89  1.27 -2.89  1.53  1.55 -2.89  1.06 -2.89
G |  1.15  1.53 -2.89  1.68 -0.18 -0.33  1.66 -2.89  0.64
T | -1.39 -1.86 -0.03 -3.47 -3.47 -3.47 -2.37  0.36 -2.37
Alternative candidate matrices 2
Historical matrix candidates from the original ScerTF database. Expand a source to inspect its original logo, scores, and matrix values.
STP2Foat et. al.P = 1View matrix ↘
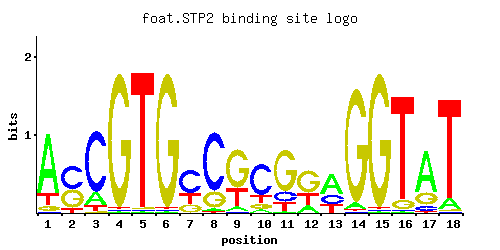
A | 0.89 0.02 0.90 0.01 0.01 0.23 0.28 0.13 0.16 0.29 0.01 0.24 0.01 0.97 0.01 0.06 0.09 0.15
C | 0.01 0.20 0.08 0.97 0.94 0.01 0.55 0.70 0.11 0.65 0.21 0.19 0.97 0.01 0.97 0.01 0.40 0.07
G | 0.01 0.09 0.01 0.01 0.01 0.24 0.01 0.17 0.67 0.01 0.75 0.57 0.01 0.01 0.01 0.78 0.51 0.01
T | 0.09 0.69 0.01 0.01 0.05 0.53 0.17 0.01 0.06 0.06 0.03 0.01 0.01 0.01 0.01 0.15 0.01 0.77
A |  89   2  90   1   1  23  28  13  16  28   1  24   1  97   1   6   9  15
C |   1  20   8  97  94   1  55  70  11  65  21  19  97   1  97   1  40   7
G |   1   9   1   1   1  24   1  17  67   1  75  56   1   1   1  78  51   1
T |   9  69   1   1   5  53  17   1   6   6   3   1   1   1   1  15   1  77
A |  1.02 -2.77  1.03 -3.47 -3.47 -0.33 -0.13 -0.90 -0.69 -0.10 -3.47 -0.29 -3.47  1.11 -3.47 -1.67 -1.27 -0.76
C | -2.89  0.11 -0.81  1.68  1.65 -2.89  1.12  1.36 -0.49  1.28  0.15  0.05  1.68 -2.89  1.68 -2.89  0.80 -0.94
G | -2.89 -0.69 -2.89 -2.89 -2.89  0.29 -2.89 -0.06  1.31 -2.89  1.43  1.15 -2.89 -2.89 -2.89  1.47  1.04 -2.89
T | -1.27  0.77 -3.47 -3.47 -1.86  0.50 -0.63 -3.47 -1.67 -1.67 -2.37 -3.47 -3.47 -3.47 -3.47 -0.76 -3.47  0.88
STP2Zhao and StormoP = 0.8213View matrix ↘
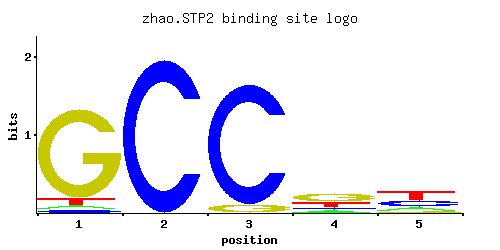
A | 0.425 0.234 0.001 0.001 0.060
C | 0.081 0.490 0.064 0.001 0.878
G | 0.331 0.140 0.934 0.997 0.028
T | 0.163 0.136 0.001 0.001 0.034
A |  42  23   0   0   6
C |   8  49   6   0  87
G |  33  14  93  99   2
T |  16  13   0   0   3
A |  0.28 -0.31 -5.77 -5.77 -1.67
C | -0.80  1.00 -1.03 -5.19  1.58
G |  0.61 -0.25  1.65  1.71 -1.86
T | -0.67 -0.86 -5.77 -5.77 -2.24
Gene-level annotations and interactions.
Genes bound in ChIP-chip experiments 61 genes
YBR040W, YBR081C, YBR130C, YBR131W, YBR195C, YBR291C, YCL024W, YCL025C, YCL065W, YCL066W, YCL067C, YCR039C, YCR040W, YCR041W, YDL041W, YDL043C, YDR048C, YDR064W, YDR065W, YDR098C, YDR102C, YDR103W, YDR215C, YDR216W, YDR383C, YFL002W-A, YFL002W-B, YFL017C, YGR024C, YGR025W, YGR026W, YGR091W, YGR199W, YGR205W, YHR125W, YHR173C, YHR174W, YJL024C, YJR052W, YJR055W, YKR074W, YLR003C, YLR143W, YLR303W, YLR334C, YLR374C, YLR379W, YLR397C, YML039W, YML040W, YML058C-A, YML069W, YNL070W, YNR009W, YOL077W-A, YOL078W, YOL079W, YOL080C, YOR192C-A, YOR192C-B, YPL266W
Genes affected by TF deletion 64 genes
YHR146W, YPL177C, YGL038C, YPL016W, YBR067C, YBR129C, YFR006W, YNL180C, YBL058W, YER029C, YDR078C, YOR229W, YBR167C, YFR044C, YLR100W, YLR438C-A, YOR043W, YDR077W, YMR023C, YNR066C, YJR148W, YLR099C, YLR101C, YOR074C, YBR265W, YGR220C, YNR035C, YPL092W, YGR012W, YIR010W, YER064C, YGR219W, YKL150W, YMR295C, YGL062W, YHR006W, YKR093W, YNL065W, YKL096W, YNL289W, YPL062W, YDR019C, YLR231C, YLR294C, YNL098C, YAR018C, YER008C, YGR108W, YGR165W, YJL167W, YMR272C, YDR174W, YCL031C, YPL163C, YAL062W, YHR200W, YMR038C, YBR244W, YHR137W, YLR049C, YDL029W, YOR375C, YHR049C-A, YIL041W
Predicted TF–TF partners 5 genes
MIG1, MIG3, NHP10, RSF2, SUT1