STB5
YHR178W
Transcription factor, involved in regulating multidrug resistance and oxidative stress response; forms a heterodimer with Pdr1p; contains a Zn(II)2Cys6 zinc finger domain that interacts with a pleiotropic drug resistance element in vitro
Best-performing DNA-binding model.
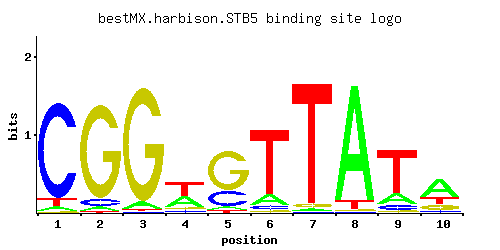
View and copy the recommended matrices ↘
A | 0.042 0.040 0.058 0.353 0.044 0.124 0.015 0.928 0.165 0.567
C | 0.892 0.063 0.005 0.083 0.255 0.056 0.008 0.005 0.080 0.063
G | 0.005 0.888 0.929 0.087 0.668 0.021 0.034 0.005 0.040 0.169
T | 0.061 0.010 0.008 0.477 0.033 0.800 0.944 0.063 0.714 0.201
A |   4   4   5  35   4  12   1  92  16  56
C |  89   6   0   8  25   5   0   0   8   6
G |   0  88  92   8  66   2   3   0   4  16
T |   6   1   0  47   3  80  94   6  71  20
A | -2.03 -2.08 -1.71  0.10 -1.98 -0.95 -3.06  1.06 -0.66  0.57
C |  1.60 -1.05 -3.58 -0.77  0.35 -1.17 -3.11 -3.58 -0.81 -1.05
G | -3.58  1.60  1.64 -0.73  1.31 -2.15 -1.67 -3.58 -1.50 -0.06
T | -1.66 -3.47 -3.69  0.40 -2.27  0.92  1.08 -1.63  0.80 -0.47
Alternative candidate matrices 8
Historical matrix candidates from the original ScerTF database. Expand a source to inspect its original logo, scores, and matrix values.
STB5Badis et. al.P = 3.07e-08View matrix ↘
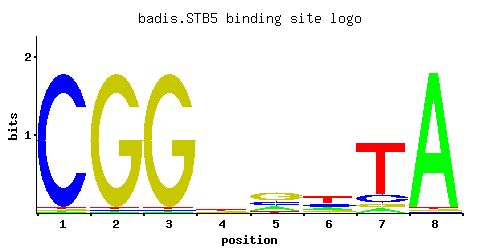
A | 0.01 0.01 0.01 0.23 0.23 0.19 0.06 0.97
C | 0.97 0.01 0.01 0.19 0.23 0.25 0.12 0.01
G | 0.01 0.97 0.97 0.26 0.47 0.12 0.06 0.01
T | 0.01 0.01 0.01 0.32 0.08 0.45 0.76 0.01
A |   1   1   1  23  23  19   6  97
C |  97   1   1  19  23  25  12   1
G |   1  97  97  26  47  12   6   1
T |   1   1   1  32   8  45  76   1
A | -3.47 -3.47 -3.47 -0.33 -0.33 -0.52 -1.67  1.11
C |  1.68 -2.89 -2.89  0.05  0.25  0.33 -0.41 -2.89
G | -2.89  1.68  1.68  0.37  0.96 -0.41 -1.10 -2.89
T | -3.47 -3.47 -3.47  0.00 -1.39  0.34  0.86 -3.47
STB5Foat et. al.P = 1.07e-10View matrix ↘
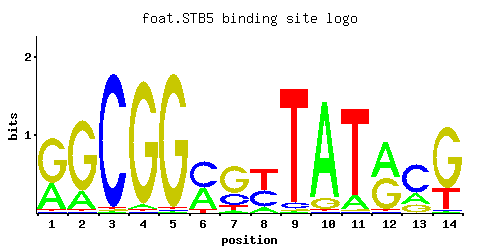
A | 0.24 0.01 0.01 0.86 0.01 0.93 0.49 0.09 0.07 0.01 0.01 0.01 0.01 0.01
C | 0.75 0.17 0.47 0.01 0.10 0.01 0.01 0.61 0.01 0.97 0.96 0.01 0.79 0.64
G | 0.01 0.61 0.01 0.01 0.01 0.05 0.38 0.25 0.52 0.01 0.01 0.97 0.01 0.01
T | 0.01 0.21 0.52 0.13 0.88 0.01 0.12 0.04 0.41 0.01 0.03 0.01 0.19 0.35
A |  24   1   1  86   1  93  49   9   7   1   1   1   1   1
C |  75  17  47   1  10   1   1  61   1  97  96   1  79  64
G |   1  61   1   1   1   5  38  25  52   1   1  97   1   1
T |   1  21  52  13  88   1  12   4  41   1   3   1  19  35
A | -0.29 -3.47 -3.47  0.99 -3.47  1.07  0.43 -1.27 -1.52 -3.47 -3.47 -3.47 -3.47 -3.47
C |  1.43 -0.06  0.96 -2.89 -0.59 -2.89 -2.89  1.22 -2.89  1.68  1.67 -2.89  1.48  1.27
G | -2.89  1.22 -2.89 -2.89 -2.89 -1.28  0.75  0.33  1.06 -2.89 -2.89  1.68 -2.89 -2.89
T | -3.47 -0.42  0.49 -0.90  1.01 -3.47 -0.98 -2.08  0.25 -3.47 -2.37 -3.47 -0.52  0.09
STB5_AFordyce et. al.P = 0.005462View matrix ↘
STB5_BFordyce et. al.P = 0.007027View matrix ↘
STB5_CFordyce et. al.P = 3.16e-06View matrix ↘
STB5Macisaac et. alP = 1.87e-13View matrix ↘
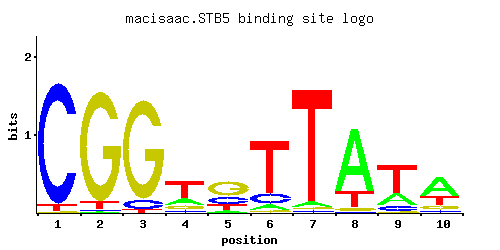
A | 0.001 0.009 0.001 0.221 0.057 0.069 0.041 0.767 0.239 0.566
C | 0.943 0.009 0.082 0.069 0.248 0.145 0.016 0.009 0.111 0.064
G | 0.009 0.922 0.891 0.150 0.530 0.030 0.016 0.035 0.032 0.130
T | 0.047 0.060 0.026 0.560 0.165 0.756 0.927 0.189 0.618 0.240
A |   0   0   0  22   5   6   4  76  23  56
C |  94   0   8   6  24  14   1   0  11   6
G |   0  92  89  15  53   3   1   3   3  13
T |   4   6   2  56  16  75  92  18  61  24
A | -5.77 -3.57 -5.77 -0.37 -1.73 -1.53 -2.05  0.87 -0.29  0.57
C |  1.66 -3.00 -0.79 -0.96  0.32 -0.22 -2.42 -3.00 -0.48 -1.03
G | -3.00  1.63  1.60 -0.18  1.08 -1.79 -2.42 -1.64 -1.73 -0.33
T | -1.92 -1.67 -2.51  0.56 -0.66  0.86  1.06 -0.53  0.66 -0.29
STB5Morozov et. al.P = 0.001282View matrix ↘
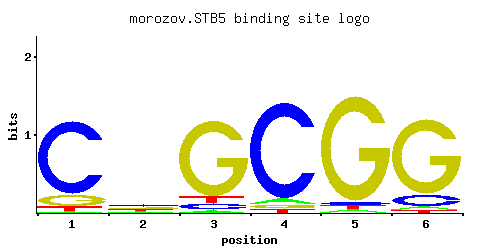
A | 0.019 0.029 0.024 0.068 0.267 0.043
C | 0.830 0.918 0.035 0.842 0.272 0.126
G | 0.122 0.030 0.898 0.067 0.330 0.821
T | 0.029 0.023 0.043 0.023 0.132 0.010
A |   1   2   2   6  26   4
C |  83  91   3  84  27  12
G |  12   3  89   6  33  82
T |   2   2   4   2  13   1
A | -2.82 -2.40 -2.59 -1.55 -0.18 -2.01
C |  1.53  1.63 -1.64  1.54  0.41 -0.36
G | -0.39 -1.79  1.61 -0.99  0.61  1.52
T | -2.40 -2.63 -2.01 -2.63 -0.89 -3.47
STB5Pachkov et alP = 3.96e-11View matrix ↘
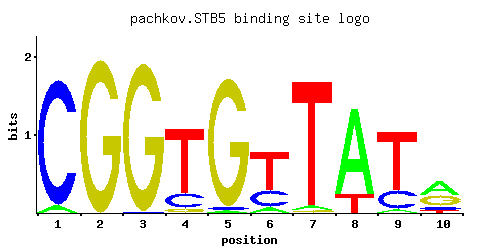
A | 0.066 0.733 0.176 0.950 0.633 0.001 0.776 0.001 0.001 0.001
C | 0.349 0.001 0.001 0.018 0.001 0.960 0.045 0.992 1.000 0.001
G | 0.110 0.234 0.001 0.001 0.281 0.023 0.176 0.008 0.001 0.948
T | 0.475 0.033 0.824 0.032 0.086 0.017 0.004 0.001 0.001 0.052
A |   6  73  17  95  63   0  77   0   0   0
C |  34   0   0   1   0  96   4  99 100   0
G |  11  23   0   0  28   2  17   0   0  94
T |  47   3  82   3   8   1   0   0   0   5
A | -1.58  0.83 -0.60  1.09  0.68 -5.77  0.89 -5.77 -5.77 -5.77
C |  0.66 -5.19 -5.19 -2.30 -5.19  1.67 -1.39  1.71  1.71 -5.19
G | -0.49  0.26 -5.19 -5.19  0.45 -2.06 -0.02 -3.11 -5.19  1.66
T |  0.39 -2.27  0.95 -2.30 -1.31 -2.94 -4.38 -5.77 -5.77 -1.82
Gene-level annotations and interactions.
Genes bound in ChIP-chip experiments 105 genes
YAR009C, YBL018C, YBR156C, YBR185C, YBR186W, YBR210W, YBR281C, YBR282W, YCR030C, YDL049C, YDL050C, YDL091C, YDL108W, YDL109C, YDL235C, YDR010C, YDR011W, YDR084C, YDR164C, YDR165W, YDR179C, YDR179W-A, YDR210W-D, YDR212W, YDR219C, YDR221W, YDR231C, YDR232W, YDR248C, YDR279W, YDR286C, YDR287W, YDR294C, YDR526C, YEL041W, YER138C, YER172C, YER173W, YFR007W, YGR022C, YGR093W, YGR150C, YGR218W, YGR289C, YHR028C, YHR123W, YHR155W, YHR156C, YHR157W, YHR161C, YHR162W, YHR163W, YHR178W, YHR183W, YHR184W, YIL159W, YIL160C, YJL008C, YJL193W, YJL195C, YJL216C, YJR088C, YJR089W, YJR098C, YJR099W, YJR153W, YKL014C, YKL077W, YKL177W, YKL179C, YLR011W, YLR152C, YLR199C, YLR200W, YLR269C, YLR271W, YLR354C, YLR401C, YLR402W, YMR156C, YMR272C, YMR315W, YNL126W, YNL273W, YNL274C, YOL041C, YOR074C, YOR075W, YOR086C, YOR087W, YOR088W, YOR166C, YOR214C, YOR251C, YOR252W, YOR256C, YOR257W, YOR353C, YPL061W, YPL062W, YPL113C, YPR016C, YPR073C, YPR074C, YPR076W
Genes affected by TF deletion 189 genes
YCR012W, YCR040W, YER178W, YGL199C, YGR282C, YKR012C, YML112W, YMR046W-A, YOL013W-A, YPL180W, YBR187W, YDL128W, YDL131W, YDR192C, YGL039W, YGL009C, YHR174W, YHR178W, YLR056W, YBR031W, YCR013C, YDR034C-A, YDR365W-B, YDR367W, YGL198W, YJR015W, YKR038C, YKR042W, YKR013W, YML113W, YCR097W-A, YGR122C-A, YHR142W, YHR143W-A, YHR145C, YDR158W, YDR529C, YHR025W, YIR028W, YIR034C, YJR116W, YLR340W, YLR372W, YOR351C, YPL187W, YGR214W, YHR208W, YML085C, YHR183W, YBR091C, YBR093C, YBR067C, YDR461W, YHR021C, YHR026W, YJL015C, YJR115W, YJR117W, YLR339C, YNL146W, YPR015C, YCL018W, YDR340W, YIL015W, YML055W, YNL300W, YBR012C, YBR012W-B, YDR012W, YLR287C-A, YNL058C, YOR229W, YDL133C-A, YDR230W, YHR123W, YJL121C, YLR439W, YLR410W-B, YMR202W, YNL279W, YCR018C-A, YER154W, YNL055C, YNL057W, YNL092W, YPL246C, YJR148W, YAL012W, YBR196C, YER001W, YGR161W-B, YOR390W, YDR502C, YFL018C, YLR380W, YOL144W, YOL086C, YBR265W, YDL198C, YGR192C, YGR256W, YKL178C, YFL014W, YCR088W, YLR343W, YMR083W, YOL143C, YPR027C, YBL032W, YJL158C, YKL175W, YKL177W, YCR059C, YOR239W, YPL252C, YIL114C, YJL097W, YLR040C, YLR420W, YOR085W, YOR393W, YPL031C, YCL066W, YCR053W, YKR086W, YML126C, YNL066W, YNL037C, YOR210W, YPL251W, YAR029W, YJL134W, YKL120W, YLR041W, YDL015C, YCR097W, YDL021W, YFL026W, YHR072W-A, YKL032C, YLR354C, YOL126C, YGL089C, YMR272C, YBR145W, YFL023W, YNL190W, YPR002C-A, YJR004C, YKL216W, YNR044W, YNL322C, YPL163C, YGL225W, YKR034W, YLR303W, YOR247W, YAL062W, YEL038W, YGR172C, YHR141C, YML019W, YLR459W, YOR063W, YBL107W-A, YLR302C, YNL045W, YOR248W, YPL257W-B, YGL032C, YLR421C, YMR215W, YLR334C, YMR158C-B, YOL134C, YOR375C, YOR034C, YCL009C, YDL182W, YDL184C, YJR009C, YKL164C, YCR102C, YDR487C, YDR519W, YNL198C, YDR365C, YER073W, YOR152C
Genes supported by both experiments 6 genes
YHR123W, YHR178W, YHR183W, YKL177W, YLR354C, YMR272C
Predicted TF–TF partners 8 genes
LYS14, MET28, MIG3, NHP6A, NHP6B, PDR8, RDS2, RTG3