STB4
YMR019W
Protein that binds Sin3p in a two-hybrid assay; contains a Zn(II)2Cys6 zinc finger domain characteristic of DNA-binding proteins; computational analysis suggests a role in regulation of expression of genes encoding transporters
Best-performing DNA-binding model.
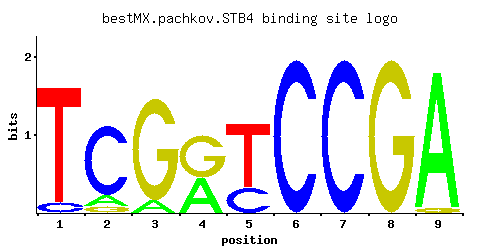
View and copy the recommended matrices ↘
A | 0.001 0.116 0.106 0.447 0.001 0.001 0.001 0.001 0.967
C | 0.079 0.813 0.001 0.001 0.285 1.000 1.000 0.001 0.001
G | 0.001 0.068 0.890 0.553 0.001 0.001 0.001 1.000 0.033
T | 0.921 0.004 0.004 0.001 0.715 0.001 0.001 0.001 0.001
A |   0  11  10  44   0   0   0   0  96
C |   7  81   0   0  28 100 100   0   0
G |   0   6  89  55   0   0   0 100   3
T |  92   0   0   0  71   0   0   0   0
A | -5.77 -1.01 -1.10  0.33 -5.77 -5.77 -5.77 -5.77  1.11
C | -0.82  1.51 -5.19 -5.19  0.46  1.71  1.71 -5.19 -5.19
G | -5.19 -0.97  1.60  1.12 -5.19 -5.19 -5.19  1.71 -1.70
T |  1.06 -4.38 -4.38 -5.77  0.80 -5.77 -5.77 -5.77 -5.77
Alternative candidate matrices 4
Historical matrix candidates from the original ScerTF database. Expand a source to inspect its original logo, scores, and matrix values.
STB4Badis et. al.P = 1.01e-05View matrix ↘
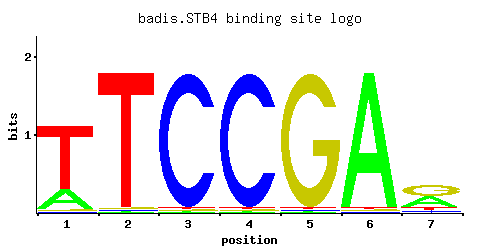
A | 0.09 0.01 0.01 0.01 0.01 0.97 0.75
C | 0.43 0.01 0.97 0.01 0.01 0.01 0.01
G | 0.09 0.01 0.01 0.97 0.97 0.01 0.01
T | 0.39 0.97 0.01 0.01 0.01 0.01 0.23
A |   9   1   1   1   1  97  75
C |  43   1  97   1   1   1   1
G |   9   1   1  97  97   1   1
T |  39  97   1   1   1   1  23
A | -1.27 -3.47 -3.47 -3.47 -3.47  1.11  0.85
C |  0.87 -2.89  1.68 -2.89 -2.89 -2.89 -2.89
G | -0.69 -2.89 -2.89  1.68  1.68 -2.89 -2.89
T |  0.20  1.11 -3.47 -3.47 -3.47 -3.47 -0.33
STB4Foat et. al.P = 0.02065View matrix ↘
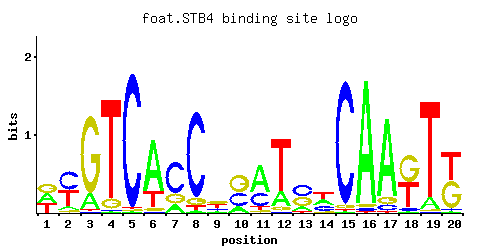
A | 0.34 0.07 0.16 0.01 0.01 0.72 0.16 0.02 0.11 0.16 0.59 0.20 0.15 0.30 0.01 0.95 0.84 0.01 0.10 0.01
C | 0.01 0.49 0.01 0.01 0.97 0.01 0.63 0.87 0.21 0.37 0.30 0.01 0.43 0.29 0.95 0.02 0.07 0.05 0.01 0.04
G | 0.34 0.05 0.82 0.09 0.01 0.05 0.20 0.07 0.36 0.46 0.05 0.06 0.37 0.05 0.03 0.02 0.08 0.50 0.01 0.48
T | 0.32 0.39 0.01 0.89 0.01 0.22 0.01 0.04 0.32 0.01 0.06 0.73 0.05 0.35 0.01 0.01 0.01 0.44 0.88 0.48
A |  34   7  16   1   1  72  16   2  11  16  59  20  15  30   1  95  84   1  10   1
C |   1  49   1   1  97   1  63  87  21  37  30   1  43  28  95   2   7   5   1   4
G |  34   5  82   9   1   5  20   7  36  46   5   6  37   5   3   2   8  50   1  48
T |  32  39   1  89   1  22   1   4  32   1   6  73   5  35   1   1   1  44  88  48
A |  0.06 -1.52 -0.69 -3.47 -3.47  0.81 -0.69 -2.77 -1.07 -0.69  0.61 -0.47 -0.76 -0.06 -3.47  1.09  0.97 -3.47 -1.16 -3.47
C | -2.89  1.00 -2.89 -2.89  1.68 -2.89  1.25  1.58  0.15  0.72  0.51 -2.89  0.87  0.48  1.66 -2.20 -0.94 -1.28 -2.89 -1.50
G |  0.64 -1.28  1.52 -0.69 -2.89 -1.28  0.11 -0.94  0.69  0.94 -1.28 -1.10  0.72 -1.28 -1.79 -2.20 -0.81  1.02 -2.89  0.98
T |  0.00  0.20 -3.47  1.02 -3.47 -0.37 -3.47 -2.08  0.00 -3.47 -1.67  0.82 -1.86  0.09 -3.47 -3.47 -3.47  0.32  1.01  0.41
STB4Harbison et. al.P = 1.64e-06View matrix ↘
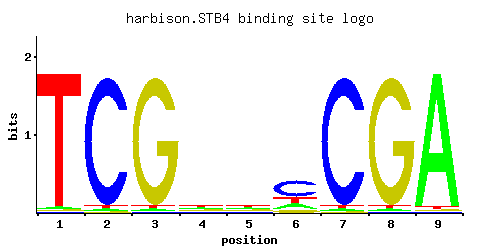
A | 0.015 0.015 0.015 0.162 0.310 0.310 0.015 0.015 0.967
C | 0.009 0.961 0.009 0.100 0.190 0.190 0.961 0.009 0.009
G | 0.009 0.009 0.961 0.576 0.190 0.190 0.009 0.961 0.009
T | 0.967 0.015 0.015 0.162 0.310 0.310 0.015 0.015 0.015
A |   1   1   1  16  31  31   1   1  96
C |   0  96   0  10  19  19  96   0   0
G |   0   0  96  57  19  19   0  96   0
T |  96   1   1  16  31  31   1   1   1
A | -3.06 -3.06 -3.06 -0.68 -0.03 -0.03 -3.06 -3.06  1.11
C | -3.00  1.68 -3.00 -0.59  0.05  0.05  1.68 -3.00 -3.00
G | -3.00 -3.00  1.68  1.16  0.05  0.05 -3.00  1.68 -3.00
T |  1.11 -3.06 -3.06 -0.68 -0.03 -0.03 -3.06 -3.06 -3.06
STB4Macisaac et. alP = 1.64e-06View matrix ↘
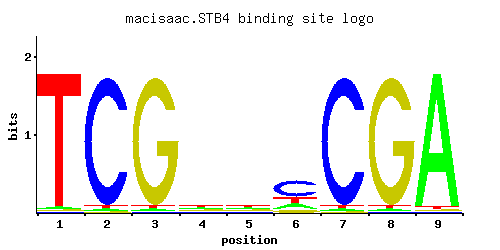
A | 0.015 0.015 0.015 0.162 0.310 0.310 0.015 0.015 0.967
C | 0.009 0.961 0.009 0.100 0.190 0.190 0.961 0.009 0.009
G | 0.009 0.009 0.961 0.576 0.190 0.190 0.009 0.961 0.009
T | 0.967 0.015 0.015 0.162 0.310 0.310 0.015 0.015 0.015
A |   1   1   1  16  31  31   1   1  96
C |   0  96   0  10  19  19  96   0   0
G |   0   0  96  57  19  19   0  96   0
T |  96   1   1  16  31  31   1   1   1
A | -3.06 -3.06 -3.06 -0.68 -0.03 -0.03 -3.06 -3.06  1.11
C | -3.00  1.68 -3.00 -0.59  0.05  0.05  1.68 -3.00 -3.00
G | -3.00 -3.00  1.68  1.16  0.05  0.05 -3.00  1.68 -3.00
T |  1.11 -3.06 -3.06 -0.68 -0.03 -0.03 -3.06 -3.06 -3.06
Gene-level annotations and interactions.
Genes bound in ChIP-chip experiments 117 genes
YAL007C, YAR007C, YAR008W, YAR009C, YAR027W, YBL050W, YBL051C, YBR046C, YBR047W, YBR065C, YBR095C, YBR096W, YBR120C, YBR222C, YBR224W, YBR225W, YBR232C, YBR256C, YBR257W, YBR292C, YCR105W, YDL017W, YDL018C, YDL057W, YDL073W, YDL074C, YDR089W, YDR090C, YDR294C, YDR318W, YDR322C-A, YDR323C, YDR372C, YDR373W, YDR440W, YDR537C, YDR539W, YEL002C, YEL020C, YER066C-A, YER068W, YER138C, YER181C, YER183C, YFR041C, YFR042W, YGL137W, YGL138C, YGL156W, YGR017W, YGR094W, YGR289C, YHL038C, YHR068W, YHR084W, YIL035C, YIL048W, YIL166C, YJL003W, YJL004C, YJL023C, YJL094C, YJL193W, YJL195C, YJR098C, YJR099W, YJR154W, YKL135C, YKL202W, YKL203C, YLL055W, YLL056C, YLL057C, YLL058W, YLL059C, YLL060C, YLL061W, YLL062C, YLR199C, YLR200W, YLR273C, YLR274W, YLR330W, YML036W, YML037C, YMR031C, YMR032W, YMR034C, YMR035W, YNL082W, YNL083W, YNL084C, YNL117W, YNL118C, YNL272C, YNR011C, YNR012W, YNR054C, YOL105C, YOR058C, YOR112W, YOR115C, YOR215C, YOR297C, YOR298W, YPL076W, YPL077C, YPL215W, YPL243W, YPL244C, YPR021C, YPR082C, YPR083W, YPR107C, YPR108W, YPR128C, YPR129W
Genes affected by TF deletion 22 genes
YHR146W, YLR461W, YMR042W, YAL001C, YBR222C, YGR151C, YPL016W, YBR093C, YBR129C, YDR281C, YOR229W, YEL008W, YMR023C, YEL020C, YLR099C, YFL048C, YPL254W, YNL289W, YMR035W, YMR034C, YFR001W, YBL051C
Genes supported by both experiments 5 genes
YBL051C, YBR222C, YEL020C, YMR034C, YMR035W
Predicted TF–TF partners 3 genes
ARG81, RDS2, SUT2