SRD1
YCR018C
Protein involved in the processing of pre-rRNA to mature rRNA; contains a C2/C2 zinc finger motif; srd1 mutation suppresses defects caused by the rrp1-1 mutation
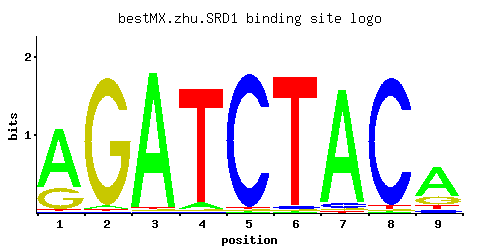
Best-performing DNA-binding model.
View and copy the recommended matrices ↘
A | 0.72 0.02 0.97 0.05 0.01 0.01 0.93 0.01 0.65
C | 0.01 0.01 0.01 0.01 0.97 0.02 0.04 0.96 0.08
G | 0.26 0.96 0.01 0.01 0.01 0.01 0.02 0.01 0.19
T | 0.01 0.01 0.01 0.93 0.01 0.96 0.01 0.02 0.08
A |  72   2  97   5   1   1  93   1  65
C |   1   1   1   1  97   2   4  96   8
G |  26  96   1   1   1   1   2   1  19
T |   1   1   1  93   1  96   1   2   8
A |  0.81 -2.77  1.11 -1.86 -3.47 -3.47  1.07 -3.47  0.71
C | -2.89 -2.89 -2.89 -2.89  1.68 -2.20 -1.50  1.67 -0.81
G |  0.37  1.67 -2.89 -2.89 -2.89 -2.89 -2.20 -2.89  0.05
T | -3.47 -3.47 -3.47  1.07 -3.47  1.10 -3.47 -2.77 -1.39
Alternative candidate matrices 3
Historical matrix candidates from the original ScerTF database. Expand a source to inspect its original logo, scores, and matrix values.
SRD1Badis et. al.P = 0.3373View matrix ↘
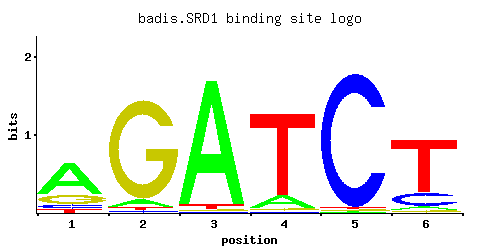
A | 0.66 0.06 0.95 0.13 0.01 0.04
C | 0.09 0.02 0.01 0.01 0.97 0.19
G | 0.19 0.90 0.01 0.02 0.01 0.03
T | 0.06 0.02 0.03 0.84 0.01 0.74
A |  66   6  95  13   1   4
C |   9   2   1   1  97  19
G |  19  90   1   2   1   3
T |   6   2   3  84   1  74
A |  0.72 -1.67  1.09 -0.90 -3.47 -2.08
C | -0.69 -2.20 -2.89 -2.89  1.68  0.05
G |  0.05  1.61 -2.89 -2.20 -2.89 -1.79
T | -1.67 -2.77 -2.37  0.97 -3.47  0.84
SRD1Foat et. al.P = 0.001784View matrix ↘
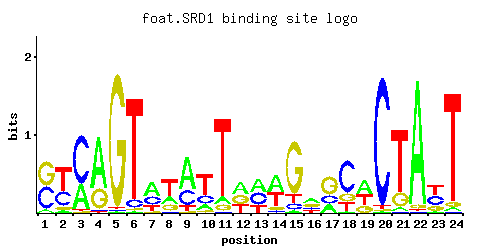
A | 0.07 0.04 0.33 0.69 0.01 0.01 0.47 0.23 0.60 0.14 0.08 0.38 0.40 0.48 0.03 0.40 0.24 0.02 0.44 0.01 0.04 0.95 0.03 0.03
C | 0.45 0.34 0.66 0.02 0.01 0.07 0.30 0.04 0.30 0.23 0.01 0.01 0.39 0.05 0.09 0.15 0.24 0.65 0.01 0.96 0.01 0.01 0.37 0.01
G | 0.48 0.07 0.01 0.28 0.97 0.02 0.03 0.19 0.01 0.05 0.07 0.33 0.01 0.09 0.77 0.31 0.52 0.17 0.24 0.01 0.18 0.03 0.22 0.04
T | 0.01 0.54 0.01 0.01 0.01 0.90 0.20 0.54 0.09 0.58 0.85 0.27 0.21 0.39 0.12 0.14 0.01 0.16 0.32 0.02 0.77 0.01 0.38 0.92
A |   7   4  33  69   1   1  47  23  60  14   8  38  40  48   3  40  24   2  44   1   4  95   3   3
C |  45  34  66   2   1   7  30   4  30  23   1   1  39   5   9  15  24  65   1  96   1   1  37   1
G |  48   7   1  28  97   2   3  19   1   5   7  33   1   9  77  31  52  17  24   1  18   3  22   4
T |   1  54   1   1   1  90  20  54   9  57  85  27  21  39  12  14   1  16  32   2  77   1  38  92
A | -1.52 -2.08  0.03  0.77 -3.47 -3.47  0.38 -0.33  0.63 -0.83 -1.39  0.17  0.22  0.41 -2.37  0.22 -0.29 -2.77  0.32 -3.47 -2.08  1.09 -2.37 -2.37
C |  0.92  0.64  1.30 -2.20 -2.89 -0.94  0.51 -1.50  0.51  0.25 -2.89 -2.89  0.77 -1.28 -0.69 -0.18  0.29  1.28 -2.89  1.67 -2.89 -2.89  0.72 -2.89
G |  0.98 -0.94 -2.89  0.44  1.68 -2.20 -1.79  0.05 -2.89 -1.28 -0.94  0.61 -2.89 -0.69  1.45  0.54  1.06 -0.06  0.29 -2.89  0.00 -1.79  0.20 -1.50
T | -3.47  0.52 -3.47 -3.47 -3.47  1.03 -0.47  0.52 -1.27  0.59  0.98 -0.17 -0.42  0.20 -0.98 -0.83 -3.47 -0.69  0.00 -2.77  0.88 -3.47  0.17  1.06
SRD1Zhao and StormoP = 1View matrix ↘
A | 0.162 0.259 0.238 0.326 0.316 0.324 0.280 0.283
C | 0.242 0.340 0.176 0.227 0.123 0.173 0.253 0.188
G | 0.320 0.212 0.359 0.316 0.332 0.265 0.209 0.272
T | 0.276 0.188 0.227 0.131 0.229 0.238 0.258 0.256
A |  16  25  23  32  31  32  28  28
C |  24  34  17  22  12  17  25  18
G |  32  21  35  31  33  26  20  27
T |  27  18  22  13  22  23  25  25
A | -0.68 -0.21 -0.30  0.02 -0.01  0.01 -0.13 -0.12
C |  0.30  0.64 -0.02  0.23 -0.38 -0.04  0.34  0.04
G |  0.58  0.16  0.69  0.56  0.61  0.39  0.15  0.41
T | -0.15 -0.53 -0.34 -0.89 -0.33 -0.30 -0.22 -0.22
Gene-level annotations and interactions.
Genes bound in ChIP-chip experiments 58 genes
YAL022C, YBL023C, YBR012W-A, YBR012W-B, YBR099C, YBR167C, YBR168W, YDL192W, YDL206W, YDL236W, YDR245W, YDR282C, YDR473C, YDR484W, YER049W, YFR017C, YGL192W, YGL194C, YGL214W, YGL216W, YGL219C, YGR166W, YGR220C, YGR277C, YGR278W, YHR072W, YHR072W-A, YHR138C, YIL015C-A, YJR033C, YJR034W, YJR054W, YJR100C, YKR056W, YLL032C, YLR261C, YLR262C, YLR372W, YLR409C, YLR410W, YLR453C, YLR454W, YML106W, YML107C, YMR187C, YMR257C, YNL009W, YNL012W, YNL013C, YNR050C, YOR005C, YOR102W, YOR138C, YOR140W, YPL034W, YPL146C, YPL251W, YPL253C
Genes affected by TF deletion 1 genes
No Data