SPT23
YKL020C
ER membrane protein involved in regulation of OLE1 transcription, acts with homolog Mga2p; inactive ER form dimerizes and one subunit is then activated by ubiquitin/proteasome-dependent processing followed by nuclear targeting
Best-performing DNA-binding model.
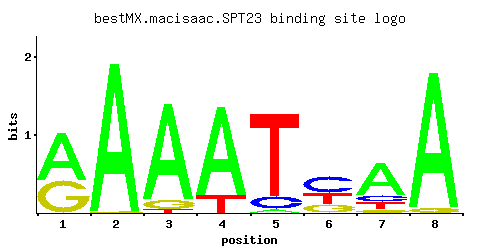
View and copy the recommended matrices ↘
A | 0.594 0.988 0.883 0.835 0.029 0.004 0.677 0.965
C | 0.001 0.001 0.001 0.001 0.129 0.464 0.132 0.001
G | 0.404 0.010 0.084 0.001 0.002 0.230 0.070 0.033
T | 0.001 0.001 0.032 0.163 0.840 0.301 0.121 0.001
A |  59  98  88  83   2   0  67  96
C |   0   0   0   0  12  46  13   0
G |  40   1   8   0   0  23   7   3
T |   0   0   3  16  84  30  12   0
A |  0.62  1.13  1.02  0.96 -2.40 -4.38  0.75  1.10
C | -5.19 -5.19 -5.19 -5.19 -0.33  0.95 -0.31 -5.19
G |  0.81 -2.89 -0.76 -5.19 -4.50  0.25 -0.94 -1.70
T | -5.77 -5.77 -2.30 -0.67  0.97 -0.06 -0.97 -5.77
Alternative candidate matrices 2
Historical matrix candidates from the original ScerTF database. Expand a source to inspect its original logo, scores, and matrix values.
SPT23Foat et. al.P = 1View matrix ↘
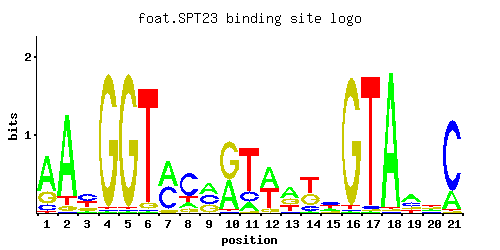
A | 0.65 0.85 0.08 0.01 0.01 0.01 0.49 0.13 0.36 0.42 0.13 0.46 0.44 0.02 0.24 0.01 0.01 0.97 0.47 0.27 0.19
C | 0.12 0.01 0.44 0.01 0.01 0.01 0.44 0.63 0.33 0.01 0.16 0.01 0.04 0.17 0.38 0.01 0.02 0.01 0.25 0.14 0.79
G | 0.22 0.05 0.19 0.97 0.97 0.05 0.07 0.10 0.31 0.57 0.01 0.10 0.29 0.34 0.11 0.96 0.01 0.01 0.15 0.27 0.01
T | 0.01 0.09 0.29 0.01 0.01 0.93 0.01 0.14 0.01 0.01 0.70 0.43 0.23 0.46 0.27 0.02 0.97 0.01 0.13 0.32 0.01
A |  65  85   8   1   1   1  49  13  36  42  13  46  44   2  24   1   1  97  47  27  19
C |  12   1  44   1   1   1  44  63  33   1  16   1   4  17  38   1   2   1  25  14  79
G |  22   5  19  97  97   5   7  10  31  56   1  10  28  34  11  96   1   1  15  27   1
T |   1   9  28   1   1  93   1  14   1   1  70  43  23  46  27   2  97   1  13  32   1
A |  0.71  0.98 -1.39 -3.47 -3.47 -3.47  0.43 -0.90  0.12  0.27 -0.90  0.36  0.32 -2.77 -0.29 -3.47 -3.47  1.11  0.38 -0.17 -0.52
C | -0.41 -2.89  0.89 -2.89 -2.89 -2.89  0.89  1.25  0.61 -2.89 -0.12 -2.89 -1.50 -0.06  0.75 -2.89 -2.20 -2.89  0.33 -0.25  1.48
G |  0.20 -1.28  0.05  1.68  1.68 -1.28 -0.94 -0.59  0.54  1.15 -2.89 -0.59  0.48  0.64 -0.49  1.67 -2.89 -2.89 -0.18  0.41 -2.89
T | -3.47 -1.27 -0.10 -3.47 -3.47  1.07 -3.47 -0.83 -3.47 -3.47  0.78  0.30 -0.33  0.36 -0.17 -2.77  1.11 -3.47 -0.90  0.00 -3.47
SPT23Harbison et. al.P = 9.86e-07View matrix ↘
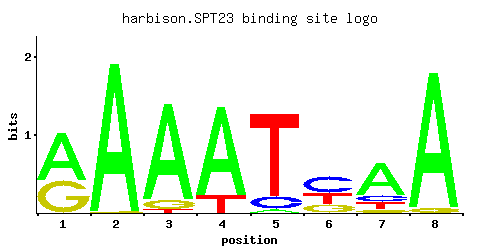
A | 0.595 0.989 0.883 0.835 0.029 0.004 0.678 0.966
C | 0.001 0.001 0.001 0.001 0.129 0.464 0.132 0.001
G | 0.404 0.010 0.084 0.001 0.002 0.230 0.070 0.033
T | 0.001 0.001 0.032 0.163 0.839 0.302 0.121 0.001
A |  59  98  88  83   2   0  67  96
C |   0   0   0   0  12  46  13   0
G |  40   1   8   0   0  23   7   3
T |   0   0   3  16  83  30  12   0
A |  0.62  1.13  1.02  0.96 -2.40 -4.38  0.75  1.10
C | -5.19 -5.19 -5.19 -5.19 -0.33  0.95 -0.31 -5.19
G |  0.81 -2.89 -0.76 -5.19 -4.50  0.25 -0.94 -1.70
T | -5.77 -5.77 -2.30 -0.67  0.96 -0.06 -0.97 -5.77
Gene-level annotations and interactions.
Genes bound in ChIP-chip experiments 86 genes
YAR050W, YBL008W, YBR099C, YBR167C, YBR168W, YBR229C, YCR018C-A, YCR019W, YCR096C, YDL068W, YDL071C, YDL146W, YDR034C-A, YDR040C, YDR041W, YDR042C, YDR084C, YDR086C, YDR144C, YDR145W, YDR210W-D, YDR245W, YDR261C, YDR278C, YDR322C-A, YDR323C, YDR473C, YDR495C, YDR520C, YER002W, YER044C-A, YER135C, YER189W, YER190W, YFR002W, YGL001C, YGR071C, YGR072W, YGR218W, YGR273C, YHR004C, YHR043C, YHR085W, YHR182W, YIR005W, YJL030W, YJL031C, YJL175W, YJL191W, YJL192C, YJL203W, YJL204C, YJR011C, YJR037W, YJR051W, YKL169C, YKL177W, YKL179C, YKR004C, YKR009C, YLR011W, YLR023C, YLR047C, YLR048W, YML031W, YMR125W, YMR178W, YMR193W, YMR194W, YMR258C, YNL001W, YNL002C, YNL050C, YOL003C, YOL079W, YOL115W, YOL159C, YOL160W, YOR058C, YOR148C, YPL051W, YPL199C, YPL216W, YPL217C, YPR104C, YPR135W
Genes affected by TF deletion 39 genes
YKL020C, YGL039W, YKL043W, YOR377W, YPL021W, YJR116W, YBR067C, YIR033W, YDR275W, YIL124W, YNR071C, YOR074C, YJR151C, YOR357C, YBR101C, YOR298C-A, YNL310C, YKR024C, YNL065W, YDR210W, YOL032W, YDR209C, YJL038C, YKL001C, YOR367W, YMR300C, YNR047W, YPL126W, YKL114C, YDR274C, YOR027W, YGL255W, YBR244W, YMR246W, YPL012W, YDL025C, YIL042C, YOL101C, YOR340C
Predicted TF–TF partners 1 genes
FZF1