SOK2
YMR016C
Nuclear protein that plays a regulatory role in the cyclic AMP (cAMP)-dependent protein kinase (PKA) signal transduction pathway; negatively regulates pseudohyphal differentiation; homologous to several transcription factors
Best-performing DNA-binding model.
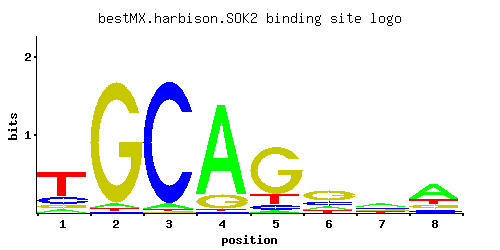
View and copy the recommended matrices ↘
A | 0.083 0.035 0.040 0.853 0.037 0.153 0.407 0.558
C | 0.190 0.005 0.947 0.005 0.080 0.233 0.213 0.122
G | 0.108 0.946 0.005 0.134 0.744 0.504 0.198 0.157
T | 0.619 0.014 0.008 0.008 0.140 0.111 0.182 0.163
A |   8   3   4  85   3  15  40  55
C |  19   0  94   0   8  23  21  12
G |  10  94   0  13  74  50  19  15
T |  61   1   0   0  14  11  18  16
A | -1.35 -2.21 -2.08  0.98 -2.16 -0.74  0.24  0.56
C |  0.05 -3.58  1.66 -3.58 -0.81  0.26  0.17 -0.39
G | -0.51  1.66 -3.58 -0.30  1.42  1.03  0.10 -0.14
T |  0.66 -3.13 -3.69 -3.69 -0.83 -1.06 -0.56 -0.67
Alternative candidate matrices 4
Historical matrix candidates from the original ScerTF database. Expand a source to inspect its original logo, scores, and matrix values.
SOK2Badis et. al.P = 6.25e-13View matrix ↘
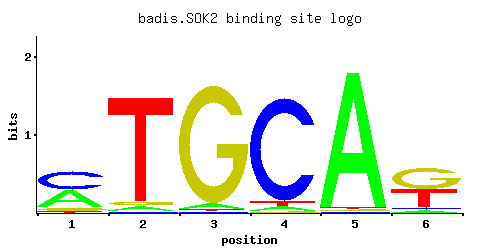
A | 0.41 0.04 0.04 0.04 0.97 0.05
C | 0.47 0.01 0.01 0.91 0.01 0.05
G | 0.09 0.04 0.94 0.01 0.01 0.50
T | 0.03 0.91 0.01 0.04 0.01 0.40
A |  41   4   4   4  97   5
C |  47   1   1  91   1   5
G |   9   4  94   1   1  50
T |   3  91   1   4   1  40
A |  0.25 -2.08 -2.08 -2.08  1.11 -1.86
C |  0.96 -2.89 -2.89  1.62 -2.89 -1.28
G | -0.69 -1.50  1.65 -2.89 -2.89  1.02
T | -2.37  1.05 -3.47 -2.08 -3.47  0.22
SOK2_AFoat et. al.P = 2.10e-09View matrix ↘
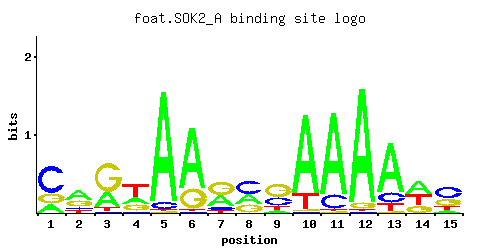
A | 0.17 0.46 0.29 0.25 0.92 0.74 0.36 0.30 0.07 0.82 0.84 0.93 0.73 0.42 0.07
C | 0.60 0.12 0.03 0.04 0.06 0.01 0.10 0.43 0.31 0.01 0.15 0.01 0.15 0.01 0.48
G | 0.22 0.32 0.60 0.23 0.01 0.25 0.47 0.27 0.50 0.01 0.01 0.05 0.01 0.24 0.31
T | 0.01 0.11 0.07 0.48 0.01 0.01 0.07 0.01 0.12 0.16 0.01 0.01 0.11 0.34 0.14
A |  17  46  28  25  92  74  36  30   7  82  84  93  73  42   7
C |  60  12   3   4   6   1  10  43  31   1  15   1  15   1  48
G |  22  32  60  23   1  25  47  27  50   1   1   5   1  24  31
T |   1  11   7  48   1   1   7   1  12  16   1   1  11  34  14
A | -0.63  0.36 -0.10 -0.25  1.06  0.84  0.12 -0.06 -1.52  0.94  0.97  1.07  0.82  0.27 -1.52
C |  1.20 -0.41 -1.79 -1.50 -1.10 -2.89 -0.59  0.87  0.54 -2.89 -0.18 -2.89 -0.18 -2.89  0.98
G |  0.20  0.58  1.20  0.25 -2.89  0.33  0.96  0.41  1.02 -2.89 -2.89 -1.28 -2.89  0.29  0.54
T | -3.47 -1.07 -1.52  0.41 -3.47 -3.47 -1.52 -3.47 -0.98 -0.69 -3.47 -3.47 -1.07  0.06 -0.83
SOK2_BFoat et. al.P = 1.42e-11View matrix ↘
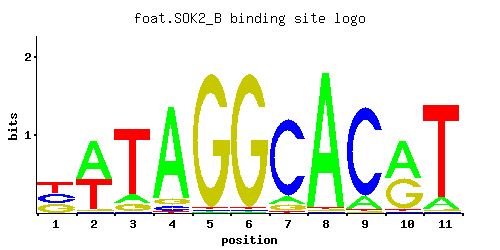
A | 0.01 0.55 0.10 0.88 0.01 0.01 0.08 0.97 0.12 0.54 0.11
C | 0.32 0.01 0.01 0.05 0.01 0.01 0.84 0.01 0.87 0.01 0.01
G | 0.31 0.01 0.09 0.06 0.97 0.97 0.07 0.01 0.01 0.45 0.01
T | 0.36 0.44 0.80 0.01 0.01 0.01 0.01 0.01 0.01 0.01 0.88
A |   1  55  10  88   1   1   8  97  12  54  11
C |  32   1   1   5   1   1  84   1  87   1   1
G |  31   1   9   6  97  97   7   1   1  45   1
T |  36  44  80   1   1   1   1   1   1   1  88
A | -3.47  0.54 -1.16  1.01 -3.47 -3.47 -1.39  1.11 -0.98  0.52 -1.07
C |  0.58 -2.89 -2.89 -1.28 -2.89 -2.89  1.54 -2.89  1.58 -2.89 -2.89
G |  0.54 -2.89 -0.69 -1.10  1.68  1.68 -0.94 -2.89 -2.89  0.92 -2.89
T |  0.12  0.32  0.92 -3.47 -3.47 -3.47 -3.47 -3.47 -3.47 -3.47  1.01
SOK2Macisaac et. alP = 6.86e-17View matrix ↘
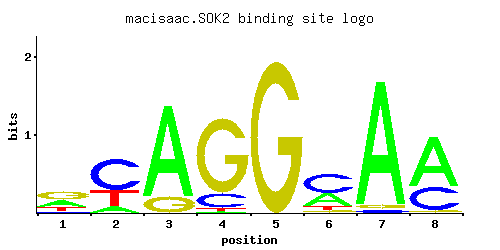
A | 0.336 0.115 0.845 0.009 0.003 0.339 0.946 0.655
C | 0.076 0.599 0.001 0.158 0.001 0.528 0.021 0.321
G | 0.421 0.001 0.153 0.814 0.995 0.048 0.032 0.023
T | 0.168 0.285 0.001 0.019 0.001 0.085 0.001 0.001
A |  33  11  84   0   0  33  94  65
C |   7  59   0  15   0  52   2  32
G |  42   0  15  81  99   4   3   2
T |  16  28   0   1   0   8   0   0
A |  0.05 -1.02  0.97 -3.57 -4.67  0.06  1.08  0.72
C | -0.86  1.20 -5.19 -0.13 -5.19  1.08 -2.15  0.58
G |  0.85 -5.19 -0.16  1.51  1.71 -1.32 -1.73 -2.06
T | -0.64 -0.12 -5.77 -2.82 -5.77 -1.33 -5.77 -5.77
Gene-level annotations and interactions.
Genes bound in ChIP-chip experiments 52 genes
YAL064W, YBL029W, YBR280C, YCR098C, YDL245C, YDL246C, YDR077W, YDR098C, YDR259C, YDR441C, YDR442W, YEL040W, YEL069C, YEL070W, YER033C, YER034W, YER045C, YFL026W, YFL027C, YGL158W, YGR084C, YGR249W, YGR282C, YHR005C, YHR094C, YHR095W, YHR118C, YHR119W, YIL099W, YIL118W, YIL119C, YIL170W, YIL171W, YIL172C, YIR020C, YJL216C, YJL219W, YJL221C, YJR158W, YJR159W, YKL007W, YKL008C, YKL044W, YKL110C, YLR043C, YMR119W, YMR119W-A, YMR319C, YNL217W, YOL156W, YOL157C, YPR013C
Genes affected by TF deletion 93 genes
YKR012C, YMR016C, YHR146W, YKL043W, YOR071C, YPL047W, YGR279C, YKR013W, YOR192C, YHR179W, YKL044W, YPL016W, YDR342C, YGR033C, YHR053C, YLR342W, YMR105C, YOR317W, YGR250C, YMR314W, YFR016C, YBR093C, YBR067C, YBR129C, YFR006W, YOR086C, YER029C, YBR010W, YCR050C, YNL030W, YLR100W, YBR009C, YMR017W, YNR066C, YJR148W, YER001W, YLR101C, YOR074C, YDR343C, YOL150C, YJL217W, YFL014W, YLR313C, YLR377C, YOL149W, YPL137C, YBR264C, YBR296C, YKL062W, YNL255C, YER158C, YMR060C, YNL031C, YAR018C, YGR139W, YKL120W, YPL061W, YBR084C-A, YOR305W, YOR367W, YJL167W, YLR355C, YOL119C, YOL151W, YOL123W, YER094C, YER067W, YER044C, YER100W, YNR044W, YPL127C, YER091C, YMR002W, YGR176W, YGL255W, YLR237W, YLR300W, YMR034C, YMR038C, YKL009W, YAL061W, YGL032C, YGR147C, YHR135C, YHR139C, YLR079W, YNL264C, YDL027C, YHR049W, YLR398C, YIL011W, YOR374W, YPR176C
Genes supported by both experiments 1 genes
YKL044W
Predicted TF–TF partners 5 genes
AFT1, GIS1, RGM1, SKN7, USV1