SNT2
YGL131C
DNA binding protein with similarity to the S. pombe Snt2 protein; computational analysis suggests a role in regulation of expression of genes encoding amine transporters
Best-performing DNA-binding model.
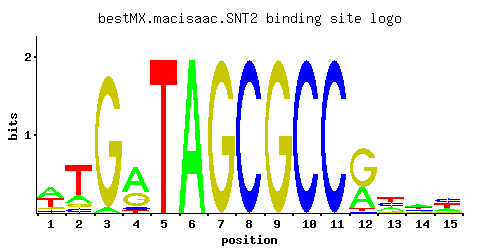
View and copy the recommended matrices ↘
A | 0.446 0.162 0.036 0.570 0.001 0.997 0.001 0.001 0.001 0.001 0.001 0.326 0.208 0.333 0.185
C | 0.099 0.088 0.001 0.081 0.001 0.001 0.001 0.997 0.001 0.997 0.997 0.011 0.349 0.190 0.360
G | 0.099 0.088 0.962 0.313 0.001 0.001 0.997 0.001 0.997 0.001 0.001 0.627 0.088 0.167 0.099
T | 0.356 0.662 0.001 0.036 0.997 0.001 0.001 0.001 0.001 0.001 0.001 0.036 0.356 0.310 0.356
A |  44  16   3  56   0  99   0   0   0   0   0  32  20  33  18
C |   9   8   0   8   0   0   0  99   0  99  99   1  34  19  36
G |   9   8  96  31   0   0  99   0  99   0   0  62   8  16   9
T |  35  66   0   3  99   0   0   0   0   0   0   3  35  31  35
A |  0.33 -0.68 -2.18  0.58 -5.77  1.14 -5.77 -5.77 -5.77 -5.77 -5.77  0.02 -0.43  0.04 -0.55
C | -0.60 -0.72 -5.19 -0.80 -5.19 -5.19 -5.19  1.71 -5.19  1.71  1.71 -2.80  0.66  0.05  0.69
G | -0.60 -0.72  1.68  0.55 -5.19 -5.19  1.71 -5.19  1.71 -5.19 -5.19  1.25 -0.72 -0.07 -0.60
T |  0.11  0.73 -5.77 -2.18  1.14 -5.77 -5.77 -5.77 -5.77 -5.77 -5.77 -2.18  0.11 -0.03  0.11
Alternative candidate matrices 3
Historical matrix candidates from the original ScerTF database. Expand a source to inspect its original logo, scores, and matrix values.
SNT2Foat et. al.P = 1View matrix ↘
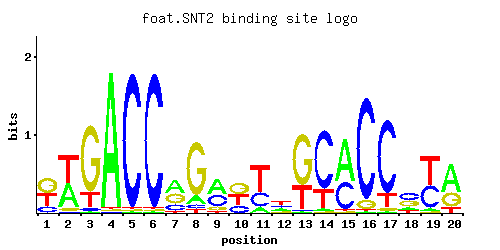
A | 0.11 0.52 0.11 0.14 0.01 0.01 0.23 0.30 0.37 0.58 0.35 0.04 0.05 0.02 0.01 0.01 0.01 0.17 0.50 0.36
C | 0.31 0.02 0.36 0.03 0.08 0.01 0.01 0.68 0.13 0.01 0.39 0.13 0.77 0.37 0.01 0.01 0.01 0.79 0.05 0.44
G | 0.01 0.42 0.40 0.82 0.90 0.39 0.74 0.01 0.30 0.30 0.26 0.37 0.06 0.20 0.97 0.97 0.01 0.03 0.01 0.19
T | 0.58 0.04 0.12 0.01 0.01 0.60 0.02 0.01 0.20 0.12 0.01 0.46 0.12 0.41 0.01 0.01 0.97 0.01 0.43 0.01
A |  11  52  11  14   1   1  23  30  37  57  35   4   5   2   1   1   1  17  50  36
C |  31   2  36   3   8   1   1  68  13   1  39  13  77  37   1   1   1  79   5  44
G |   1  42  40  82  90  39  74   1  30  30  26  37   6  20  97  97   1   3   1  19
T |  57   4  12   1   1  60   2   1  20  12   1  46  12  41   1   1  97   1  43   1
A | -1.07  0.49 -1.07 -0.83 -3.47 -3.47 -0.33 -0.06  0.15  0.59  0.09 -2.08 -1.86 -2.77 -3.47 -3.47 -3.47 -0.63  0.45  0.12
C |  0.54 -2.20  0.69 -1.79 -0.81 -2.89 -2.89  1.33 -0.33 -2.89  0.77 -0.33  1.45  0.72 -2.89 -2.89 -2.89  1.48 -1.28  0.89
G | -2.89  0.85  0.80  1.52  1.61  0.77  1.41 -2.89  0.51  0.51  0.37  0.72 -1.10  0.11  1.68  1.68 -2.89 -1.79 -2.89  0.05
T |  0.59 -2.08 -0.98 -3.47 -3.47  0.63 -2.77 -3.47 -0.47 -0.98 -3.47  0.36 -0.98  0.25 -3.47 -3.47  1.11 -3.47  0.30 -3.47
SNT2Harbison et. al.P = 2.81e-33View matrix ↘
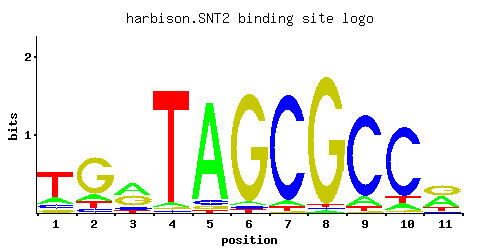
A | 0.131 0.078 0.046 0.014 0.033 0.022 0.017 0.928 0.081 0.109 0.632
C | 0.415 0.027 0.010 0.960 0.009 0.924 0.042 0.017 0.377 0.704 0.087
G | 0.059 0.824 0.853 0.013 0.917 0.025 0.045 0.017 0.099 0.070 0.111
T | 0.395 0.071 0.091 0.013 0.041 0.029 0.896 0.038 0.443 0.118 0.170
A |  13   7   4   1   3   2   1  92   8  10  63
C |  41   2   1  96   0  92   4   1  37  70   8
G |   5  82  85   1  91   2   4   1   9   7  11
T |  39   7   9   1   4   2  89   3  44  11  17
A | -0.89 -1.41 -1.94 -3.13 -2.27 -2.68 -2.94  1.06 -1.37 -1.08  0.68
C |  0.84 -1.90 -2.89  1.67 -3.00  1.64 -1.46 -2.36  0.74  1.36 -0.73
G | -1.12  1.52  1.56 -2.63  1.63 -1.97 -1.39 -2.36 -0.60 -0.94 -0.48
T |  0.21 -1.51 -1.26 -3.20 -2.05 -2.40  1.03 -2.13  0.33 -1.00 -0.63
SNT2Pachkov et alP = 3.91e-32View matrix ↘
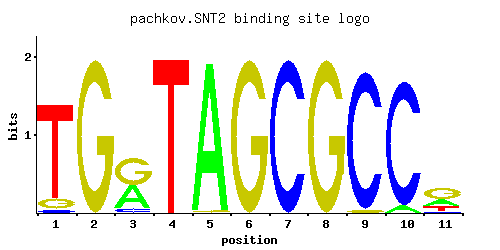
A | 0.001 0.001 0.414 0.001 0.989 0.002 0.001 0.001 0.003 0.054 0.275
C | 0.028 0.001 0.079 0.001 0.001 0.001 1.000 0.001 0.974 0.946 0.068
G | 0.097 1.000 0.507 0.001 0.011 0.998 0.001 1.000 0.024 0.001 0.486
T | 0.875 0.001 0.001 1.000 0.001 0.001 0.001 0.001 0.001 0.001 0.172
A |   0   0  41   0  98   0   0   0   0   5  27
C |   2   0   7   0   0   0 100   0  97  94   6
G |   9 100  50   0   1  99   0 100   2   0  48
T |  87   0   0 100   0   0   0   0   0   0  17
A | -5.77 -5.77  0.26 -5.77  1.13 -5.08 -5.77 -5.77 -4.67 -1.78 -0.15
C | -1.86 -5.19 -0.82 -5.19 -5.19 -5.19  1.71 -5.19  1.69  1.66 -0.97
G | -0.62  1.71  1.04 -5.19 -2.80  1.71 -5.19  1.71 -2.01 -5.19  0.99
T |  1.01 -5.77 -5.77  1.14 -5.77 -5.77 -5.77 -5.77 -5.77 -5.77 -0.62
Gene-level annotations and interactions.
Genes bound in ChIP-chip experiments 71 genes
YAL038W, YAL039C, YAL053W, YAL054C, YAR050W, YBL073W, YBL074C, YBL075C, YBL095W, YBR138C, YBR139W, YBR143C, YCR090C, YCR091W, YDR008C, YDR009W, YDR046C, YDR047W, YDR261W-A, YDR261W-B, YDR366C, YDR368W, YDR543C, YER189W, YER190W, YGR110W, YHR009C, YHR010W, YHR138C, YHR160C, YHR175W, YHR214C-B, YHR214C-C, YHR215W, YHR216W, YHR218W, YHR219W, YIL102C, YIL155C, YIL159W, YIL160C, YJL092W, YJL093C, YJL148W, YJL184W, YJL185C, YJR130C, YJR131W, YJR153W, YKL171W, YLL004W, YLL005C, YLR149C, YLR150W, YLR176C, YLR177W, YLR228C, YLR230W, YLR373C, YLR375W, YMR045C, YMR046C, YMR052W, YNL181W, YNL182C, YNL337W, YOL116W, YOR236W, YPR104C, YPR158W, YPR184W
Genes affected by TF deletion 1 genes
No Data