SKO1
YNL167C, ACR1
Basic leucine zipper (bZIP) transcription factor of the ATF/CREB family, forms a complex with Tup1p and Ssn6p to both activate and repress transcription; cytosolic and nuclear protein involved in osmotic and oxidative stress responses
Best-performing DNA-binding model.
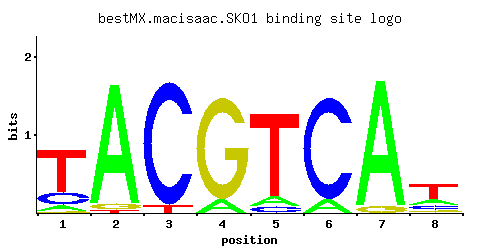
View and copy the recommended matrices ↘
A | 0.089 0.938 0.001 0.111 0.092 0.113 0.945 0.211
C | 0.199 0.001 0.943 0.002 0.060 0.885 0.001 0.152
G | 0.016 0.045 0.001 0.886 0.001 0.001 0.053 0.088
T | 0.696 0.016 0.055 0.001 0.847 0.001 0.001 0.549
A |   8  93   0  11   9  11  94  21
C |  19   0  94   0   6  88   0  15
G |   1   4   0  88   0   0   5   8
T |  69   1   5   0  84   0   0  54
A | -1.28  1.08 -5.77 -1.06 -1.25 -1.04  1.08 -0.42
C |  0.10 -5.19  1.66 -4.50 -1.10  1.59 -5.19 -0.17
G | -2.42 -1.39 -5.19  1.59 -5.19 -5.19 -1.22 -0.72
T |  0.78 -3.00 -1.76 -5.77  0.97 -5.77 -5.77  0.54
Alternative candidate matrices 7
Historical matrix candidates from the original ScerTF database. Expand a source to inspect its original logo, scores, and matrix values.
SKO1Foat et. al.P = 1.59e-07View matrix ↘
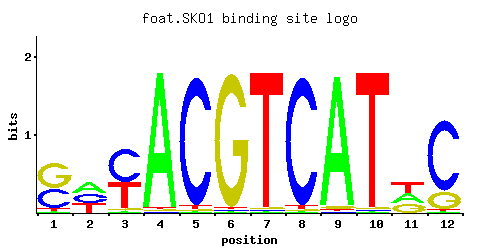
A | 0.03 0.36 0.01 0.97 0.01 0.01 0.01 0.01 0.97 0.01 0.32 0.01
C | 0.40 0.32 0.55 0.01 0.96 0.01 0.01 0.96 0.01 0.01 0.01 0.79
G | 0.52 0.01 0.03 0.01 0.01 0.97 0.01 0.01 0.02 0.01 0.31 0.19
T | 0.05 0.31 0.41 0.01 0.02 0.01 0.97 0.02 0.01 0.97 0.36 0.01
A |   3  36   1  97   1   1   1   1  97   1  32   1
C |  40  32  55   1  96   1   1  96   1   1   1  79
G |  52   1   3   1   1  97   1   1   2   1  31  19
T |   5  31  41   1   2   1  97   2   1  97  36   1
A | -2.37  0.12 -3.47  1.11 -3.47 -3.47 -3.47 -3.47  1.11 -3.47  0.00 -3.47
C |  0.80  0.58  1.12 -2.89  1.67 -2.89 -2.89  1.67 -2.89 -2.89 -2.89  1.48
G |  1.06 -2.89 -1.79 -2.89 -2.89  1.68 -2.89 -2.89 -2.20 -2.89  0.54  0.05
T | -1.86 -0.03  0.25 -3.47 -2.77 -3.47  1.11 -2.77 -3.47  1.11  0.12 -3.47
SKO1_AFordyce et. al.P = 1.27e-12View matrix ↘
SKO1_BFordyce et. al.P = 2.52e-09View matrix ↘
SKO1_CFordyce et. al.P = 2.01e-08View matrix ↘
SKO1Harbison et. al.P = 1.94e-09View matrix ↘
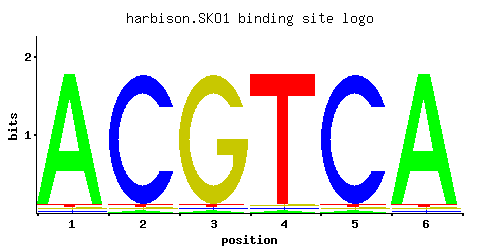
A | 0.965 0.012 0.012 0.012 0.012 0.965
C | 0.012 0.965 0.012 0.012 0.965 0.012
G | 0.012 0.012 0.965 0.012 0.012 0.012
T | 0.012 0.012 0.012 0.965 0.012 0.012
A |  96   1   1   1   1  96
C |   1  96   1   1  96   1
G |   1   1  96   1   1   1
T |   1   1   1  96   1   1
A |  1.10 -3.28 -3.28 -3.28 -3.28  1.10
C | -2.71  1.68 -2.71 -2.71  1.68 -2.71
G | -2.71 -2.71  1.68 -2.71 -2.71 -2.71
T | -3.28 -3.28 -3.28  1.10 -3.28 -3.28
SKO1Morozov et. al.P = 2.25e-09View matrix ↘
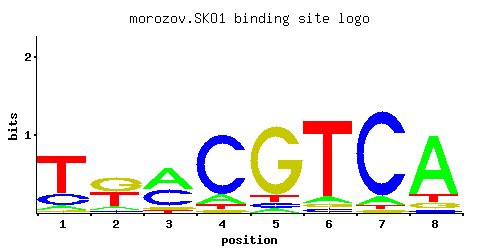
A | 0.093 0.027 0.843 0.071 0.047 0.044 0.420 0.679
C | 0.077 0.027 0.049 0.824 0.044 0.063 0.434 0.047
G | 0.044 0.865 0.044 0.060 0.791 0.404 0.060 0.203
T | 0.786 0.080 0.063 0.044 0.118 0.489 0.085 0.071
A |   9   2  84   7   4   4  42  67
C |   7   2   4  82   4   6  43   4
G |   4  86   4   6  79  40   6  20
T |  78   8   6   4  11  48   8   7
A | -1.24 -2.47  0.97 -1.51 -1.92 -1.98  0.27  0.75
C | -0.85 -1.90 -1.30  1.52 -1.41 -1.05  0.88 -1.34
G | -1.41  1.57 -1.41 -1.10  1.48  0.81 -1.10  0.12
T |  0.90 -1.39 -1.63 -1.98 -1.00  0.42 -1.33 -1.51
SKO1Pachkov et alP = 0.3698View matrix ↘
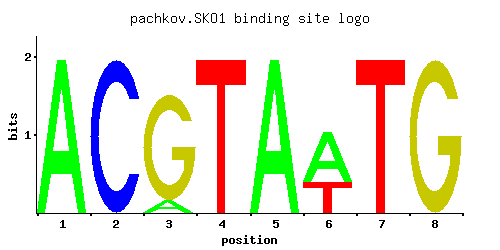
A | 1.000 0.001 0.100 0.001 1.000 0.619 0.001 0.001
C | 0.001 1.000 0.001 0.001 0.001 0.001 0.001 0.001
G | 0.001 0.001 0.900 0.001 0.001 0.001 0.001 1.000
T | 0.001 0.001 0.001 1.000 0.001 0.381 1.000 0.001
A | 100   0  10   0 100  61   0   0
C |   0 100   0   0   0   0   0   0
G |   0   0  90   0   0   0   0 100
T |   0   0   0 100   0  38 100   0
A |  1.14 -5.77 -1.16 -5.77  1.14  0.66 -5.77 -5.77
C | -5.19  1.71 -5.19 -5.19 -5.19 -5.19 -5.19 -5.19
G | -5.19 -5.19  1.61 -5.19 -5.19 -5.19 -5.19  1.71
T | -5.77 -5.77 -5.77  1.14 -5.77  0.17  1.14 -5.77
Gene-level annotations and interactions.
Genes bound in ChIP-chip experiments 93 genes
YBL029W, YBL030C, YBL043W, YBR112C, YBR114W, YDR072C, YDR073W, YDR077W, YDR210W-D, YDR259C, YDR441C, YDR442W, YDR535C, YDR536W, YEL069C, YER017C, YER075C, YER076C, YER149C, YER150W, YFL014W, YFL015C, YFL016C, YGR050C, YGR140W, YGR150C, YGR241C, YGR243W, YGR249W, YHL041W, YHR033W, YHR049W, YHR096C, YIL119C, YIL122W, YIL170W, YIL171W, YIL172C, YJL106W, YJL107C, YJL108C, YJL219W, YJL221C, YJR145C, YJR146W, YJR147W, YKL060C, YKL096W, YKL110C, YKR040C, YKR042W, YLR108C, YLR109W, YLR286C, YLR300W, YMR017W, YMR037C, YMR070W, YMR135C, YMR136W, YMR151W, YMR172C-A, YMR173W, YMR173W-A, YMR239C, YMR303C, YMR304W, YNL178W, YNR034W, YOL156W, YOL157C, YOR028C, YOR029W, YOR246C, YOR247W, YOR248W, YOR317W, YOR318C, YOR319W, YOR348C, YOR349W, YOR374W, YPL024W, YPL025C, YPL061W, YPL062W, YPL081W, YPL082C, YPR005C, YPR013C, YPR063C, YPR064W, YPR065W
Genes affected by TF deletion 138 genes
YDR368W, YML112W, YNR061C, YHR146W, YPL053C, YCL047C, YNR060W, YPL177C, YAL053W, YBR157C, YBR161W, YOR038C, YPL016W, YOL136C, YPL135W, YML027W, YNR026C, YNR028W, YBR067C, YBR129C, YFR006W, YJR144W, YMR104C, YNL116W, YBL058W, YBR288C, YDR309C, YDR279W, YER029C, YGR243W, YIL015W, YKL206C, YLR183C, YIL118W, YOR229W, YPL215W, YAR015W, YOR043W, YDR077W, YNR066C, YJR148W, YLR099C, YMR199W, YOR074C, YHR033W, YOL150C, YBR265W, YDR347W, YGR220C, YNR035C, YPL118W, YPL122C, YPL092W, YPL156C, YBR135W, YFL048C, YGR012W, YHR094C, YLR343W, YOR324C, YOR354C, YPR057W, YOR341W, YCL027W, YBR264C, YDL201W, YER064C, YGL112C, YGR219W, YGR253C, YHR214W-A, YKL144C, YKL212W, YKL150W, YKL214C, YLR191W, YLR163C, YLR195C, YMR321C, YMR295C, YNR003C, YNR034W, YMR055C, YML131W, YNL065W, YKL096W, YNL289W, YDR019C, YLR260W, YMR060C, YNL098C, YNL100W, YAR018C, YGR108W, YGR139W, YOL156W, YOR367W, YJL167W, YHR096C, YLR353W, YOL151W, YOL155C, YBL071C, YNR044W, YPL163C, YBR054W, YHR018C, YIL170W, YLR297W, YGR144W, YHR200W, YMR247C, YIL169C, YLR300W, YMR034C, YNL076W, YBR244W, YEL037C, YGL032C, YJL108C, YLR049C, YLR081W, YLR452C, YDL023C, YDR122W, YHR049W, YNL167C, YNR018W, YBR089W, YDL022W, YFR025C, YGR052W, YJL044C, YIL010W, YIL041W, YNR052C, YNL330C, YOR184W
Genes supported by both experiments 11 genes
YDR077W, YGR243W, YHR033W, YHR049W, YHR096C, YIL170W, YJL108C, YKL096W, YLR300W, YNR034W, YOL156W
Predicted TF–TF partners 1 genes
SUM1