SFL1
YOR140W
Transcriptional repressor and activator; involved in repression of flocculation-related genes, and activation of stress responsive genes; negatively regulated by cAMP-dependent protein kinase A subunit Tpk2p
Best-performing DNA-binding model.
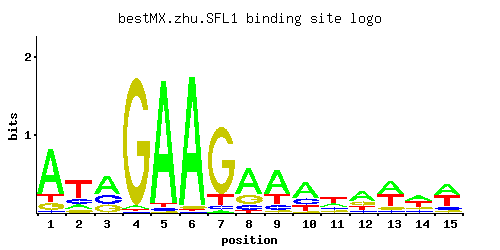
View and copy the recommended matrices ↘
A | 0.73 0.13 0.50 0.02 0.95 0.96 0.02 0.62 0.60 0.54 0.26 0.49 0.43 0.37 0.41
C | 0.03 0.18 0.26 0.01 0.02 0.01 0.05 0.13 0.13 0.22 0.16 0.10 0.07 0.12 0.12
G | 0.12 0.11 0.23 0.96 0.01 0.02 0.81 0.22 0.04 0.05 0.15 0.22 0.10 0.15 0.07
T | 0.12 0.59 0.01 0.01 0.02 0.01 0.12 0.04 0.23 0.19 0.44 0.19 0.40 0.36 0.40
A |  73  13  50   2  95  96   2  62  60  54  26  49  43  37  41
C |   3  18  26   1   2   1   5  13  13  22  16  10   7  12  12
G |  12  11  23  96   1   2  81  22   4   5  15  22  10  15   7
T |  12  59   1   1   2   1  12   4  23  19  44  19  40  36  40
A |  0.82 -0.90  0.45 -2.77  1.09  1.10 -2.77  0.66  0.63  0.52 -0.21  0.43  0.30  0.15  0.25
C | -1.79  0.00  0.37 -2.89 -2.20 -2.89 -1.28 -0.33 -0.33  0.20 -0.12 -0.59 -0.94 -0.41 -0.41
G | -0.41 -0.49  0.25  1.67 -2.89 -2.20  1.50  0.20 -1.50 -1.28 -0.18  0.20 -0.59 -0.18 -0.94
T | -0.98  0.61 -3.47 -3.47 -2.77 -3.47 -0.98 -2.08 -0.33 -0.52  0.32 -0.52  0.22  0.12  0.22
Alternative candidate matrices 3
Historical matrix candidates from the original ScerTF database. Expand a source to inspect its original logo, scores, and matrix values.
SFL1Foat et. al.P = 1View matrix ↘
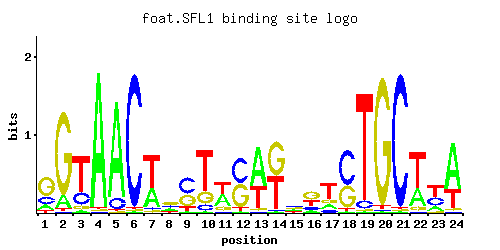
A | 0.15 0.12 0.04 0.97 0.89 0.01 0.33 0.22 0.04 0.01 0.41 0.01 0.62 0.01 0.23 0.10 0.16 0.01 0.01 0.01 0.01 0.30 0.17 0.69
C | 0.21 0.01 0.23 0.01 0.10 0.97 0.04 0.29 0.50 0.10 0.05 0.49 0.01 0.01 0.33 0.15 0.11 0.59 0.07 0.01 0.97 0.01 0.32 0.02
G | 0.59 0.85 0.07 0.01 0.01 0.01 0.03 0.37 0.33 0.21 0.13 0.44 0.04 0.51 0.28 0.47 0.16 0.36 0.01 0.96 0.01 0.07 0.05 0.03
T | 0.06 0.02 0.67 0.01 0.01 0.01 0.60 0.12 0.12 0.69 0.41 0.06 0.34 0.48 0.16 0.28 0.57 0.04 0.92 0.02 0.01 0.63 0.47 0.27
A |  15  12   4  97  89   1  33  22   4   1  41   1  62   1  23  10  16   1   1   1   1  30  17  69
C |  21   1  23   1  10  97   4  28  50  10   5  49   1   1  33  15  11  59   7   1  97   1  32   2
G |  59  85   7   1   1   1   3  37  33  21  13  44   4  51  28  47  16  36   1  96   1   7   5   3
T |   6   2  67   1   1   1  60  12  12  69  41   6  34  48  16  28  56   4  92   2   1  63  47  27
A | -0.76 -0.98 -2.08  1.11  1.02 -3.47  0.03 -0.37 -2.08 -3.47  0.25 -3.47  0.66 -3.47 -0.33 -1.16 -0.69 -3.47 -3.47 -3.47 -3.47 -0.06 -0.63  0.77
C |  0.15 -2.89  0.25 -2.89 -0.59  1.68 -1.50  0.48  1.02 -0.59 -1.28  1.00 -2.89 -2.89  0.61 -0.18 -0.49  1.19 -0.94 -2.89  1.68 -2.89  0.58 -2.20
G |  1.19  1.55 -0.94 -2.89 -2.89 -2.89 -1.79  0.72  0.61  0.15 -0.33  0.89 -1.50  1.04  0.44  0.96 -0.12  0.69 -2.89  1.67 -2.89 -0.94 -1.28 -1.79
T | -1.67 -2.77  0.74 -3.47 -3.47 -3.47  0.63 -0.98 -0.98  0.77  0.25 -1.67  0.06  0.41 -0.69 -0.13  0.58 -2.08  1.06 -2.77 -3.47  0.68  0.38 -0.17
SFL1Macisaac et. alP = 0.2694View matrix ↘
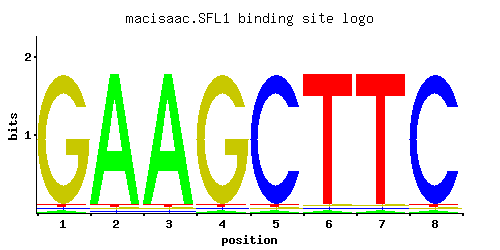
A | 0.012 0.964 0.964 0.012 0.012 0.012 0.012 0.012
C | 0.012 0.012 0.012 0.012 0.964 0.012 0.012 0.964
G | 0.964 0.012 0.012 0.964 0.012 0.012 0.012 0.012
T | 0.012 0.012 0.012 0.012 0.012 0.964 0.964 0.012
A |   1  96  96   1   1   1   1   1
C |   1   1   1   1  96   1   1  96
G |  96   1   1  96   1   1   1   1
T |   1   1   1   1   1  96  96   1
A | -3.28  1.10  1.10 -3.28 -3.28 -3.28 -3.28 -3.28
C | -2.71 -2.71 -2.71 -2.71  1.68 -2.71 -2.71  1.68
G |  1.68 -2.71 -2.71  1.68 -2.71 -2.71 -2.71 -2.71
T | -3.28 -3.28 -3.28 -3.28 -3.28  1.10  1.10 -3.28
SFL1Zhao and StormoP = 1View matrix ↘
A | 0.222 0.289 0.274 0.321 0.319 0.322 0.243 0.275
C | 0.211 0.227 0.296 0.183 0.160 0.256 0.227 0.232
G | 0.225 0.280 0.274 0.308 0.303 0.212 0.303 0.264
T | 0.342 0.204 0.156 0.187 0.218 0.210 0.227 0.229
A |  22  28  27  32  31  32  24  27
C |  21  22  29  18  16  25  22  23
G |  22  28  27  30  30  21  30  26
T |  34  20  15  18  21  21  22  22
A | -0.37 -0.10 -0.16  0.00 -0.00  0.01 -0.28 -0.15
C |  0.16  0.23  0.50  0.02 -0.12  0.35  0.23  0.25
G |  0.22  0.44  0.42  0.54  0.52  0.16  0.52  0.38
T |  0.07 -0.45 -0.72 -0.54 -0.38 -0.42 -0.34 -0.33
Gene-level annotations and interactions.
Genes bound in ChIP-chip experiments 43 genes
YAR023C, YBL018C, YBR062C, YBR064W, YBR234C, YBR235W, YCL002C, YCL006C, YCL007C, YCL008C, YCL009C, YCL010C, YCR002C, YCR004C, YCR005C, YCR006C, YCR008W, YCR012W, YCR083W, YDL037C, YDL195W, YDR141C, YDR279W, YDR441C, YDR442W, YFR054C, YGL205W, YGL206C, YGR126W, YGR157W, YGR229C, YGR230W, YGR246C, YGR247W, YGR289C, YJR041C, YJR042W, YLR353W, YMR221C, YNR065C, YNR066C, YOR106W, YPR135W
Genes affected by TF deletion 38 genes
YDR068W, YKL043W, YOR381W, YPR082C, YNR060W, YLR087C, YOR382W, YAR064W, YAR068W, YBR129C, YFR006W, YKR102W, YDL155W, YBR042C, YHR003C, YMR173W, YOL052C, YHR214W, YOR341W, YBL061C, YBR260C, YHR214W-A, YOR168W, YKR093W, YPL062W, YCL075W, YMR173W-A, YBR144C, YDR144C, YOR383C, YGR044C, YCR036W, YFL003C, YGL258W, YHR018C, YML021C, YLR269C, YKL010C