← All factors / TF RECORD
RSC3
YDR303C
Component of the RSC chromatin remodeling complex; essential gene required for maintenance of proper ploidy and regulation of ribosomal protein genes and the cell wall/stress response; highly similar to Rsc30p
01 / RECOMMENDED MATRIX
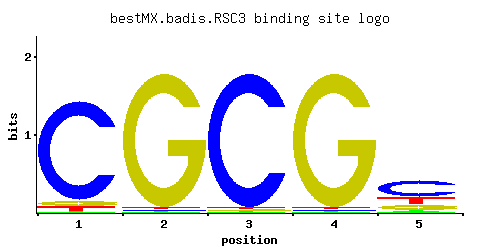
Best-performing DNA-binding model.
Fisher’s P-valueNo data
Information content9.11
Max PWM score7.78
Recommended cutoff7.73
View and copy the recommended matrices ↘
Position frequency matrix (PFM)
A | 0.01 0.01 0.01 0.01 0.06
C | 0.90 0.01 0.97 0.01 0.56
G | 0.05 0.97 0.01 0.97 0.18
T | 0.04 0.01 0.01 0.01 0.20
Position count matrix (PCM)
A |   1   1   1   1   6
C |  90   1  97   1  56
G |   5  97   1  97  18
T |   4   1   1   1  20
Position weight matrix (PWM)
A | -3.47 -3.47 -3.47 -3.47 -1.67
C |  1.61 -2.89  1.68 -2.89  1.13
G | -1.28  1.68 -2.89  1.68  0.00
T | -2.08 -3.47 -3.47 -3.47 -0.47
02 / COMPARATIVE BENCHMARKS
Alternative candidate matrices 3
Historical matrix candidates from the original ScerTF database. Expand a source to inspect its original logo, scores, and matrix values.
RSC3Badis et. al.P = No dataView matrix ↘
Fisher’s P-valueNo data
Information content9.11
Max PWM score7.78
Recommended cutoff5.84
Position frequency matrix (PFM)
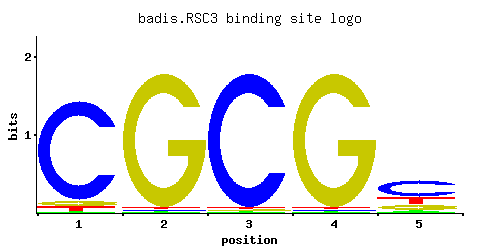
A | 0.01 0.01 0.01 0.01 0.06
C | 0.90 0.01 0.97 0.01 0.56
G | 0.05 0.97 0.01 0.97 0.18
T | 0.04 0.01 0.01 0.01 0.20
Position count matrix (PCM)
A |   1   1   1   1   6
C |  90   1  97   1  56
G |   5  97   1  97  18
T |   4   1   1   1  20
Position weight matrix (PWM)
A | -3.47 -3.47 -3.47 -3.47 -1.67
C |  1.61 -2.89  1.68 -2.89  1.13
G | -1.28  1.68 -2.89  1.68  0.00
T | -2.08 -3.47 -3.47 -3.47 -0.47
RSC3Zhu et. al.P = No dataView matrix ↘
Fisher’s P-valueNo data
Information content16.04
Max PWM score18.57
Recommended cutoff13.93
Position frequency matrix (PFM)
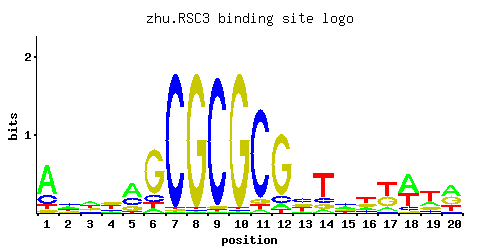
A | 0.22 0.50 0.34 0.46 0.44 0.15 0.62 0.25 0.04 0.04 0.01 0.01 0.01 0.01 0.08 0.04 0.34 0.23 0.21 0.09
C | 0.34 0.17 0.03 0.36 0.24 0.18 0.13 0.27 0.80 0.05 0.97 0.02 0.97 0.01 0.74 0.19 0.36 0.22 0.13 0.06
G | 0.03 0.11 0.12 0.05 0.15 0.35 0.15 0.39 0.09 0.89 0.01 0.96 0.01 0.97 0.11 0.28 0.16 0.14 0.34 0.21
T | 0.41 0.21 0.51 0.12 0.17 0.31 0.09 0.09 0.07 0.03 0.01 0.01 0.01 0.01 0.07 0.48 0.14 0.40 0.33 0.65
Position count matrix (PCM)
A |  22  50  34  46  44  15  62  25   4   4   1   1   1   1   8   4  34  23  21   9
C |  34  17   3  36  24  18  13  27  80   5  97   2  97   1  74  19  36  22  13   6
G |   3  11  12   5  15  35  15  39   9  89   1  96   1  97  11  28  16  14  34  21
T |  41  21  51  12  17  31   9   9   7   3   1   1   1   1   7  48  14  40  33  65
Position weight matrix (PWM)
A | -0.37  0.45  0.06  0.36  0.32 -0.76  0.66 -0.25 -2.08 -2.08 -3.47 -3.47 -3.47 -3.47 -1.39 -2.08  0.06 -0.33 -0.42 -1.27
C |  0.64 -0.06 -1.79  0.69  0.29  0.00 -0.33  0.41  1.49 -1.28  1.68 -2.20  1.68 -2.89  1.41  0.05  0.69  0.20 -0.33 -1.10
G | -1.79 -0.49 -0.41 -1.28 -0.18  0.66 -0.18  0.77 -0.69  1.60 -2.89  1.67 -2.89  1.68 -0.49  0.44 -0.12 -0.25  0.64  0.15
T |  0.25 -0.42  0.47 -0.98 -0.63 -0.03 -1.27 -1.27 -1.52 -2.37 -3.47 -3.47 -3.47 -3.47 -1.52  0.41 -0.83  0.22  0.03  0.71
RSC3Zhao and StormoP = No dataView matrix ↘
Fisher’s P-valueNo data
Information content6.183
Max PWM score7.14
Recommended cutoff5.36
Position frequency matrix (PFM)
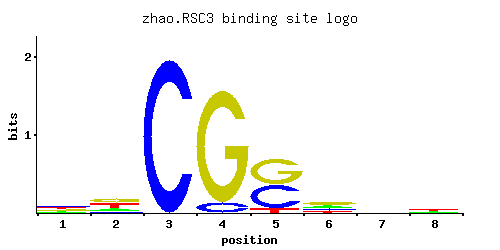
A | 0.192 0.192 0.001 0.001 0.001 0.237 0.236 0.261
C | 0.353 0.110 0.997 0.084 0.440 0.215 0.261 0.246
G | 0.197 0.356 0.001 0.914 0.482 0.399 0.208 0.182
T | 0.259 0.342 0.001 0.001 0.077 0.150 0.295 0.310
Position count matrix (PCM)
A |  19  19   0   0   0  23  23  26
C |  35  11  99   8  44  21  26  24
G |  19  35   0  91  48  39  20  18
T |  25  34   0   0   7  15  29  31
Position weight matrix (PWM)
A | -0.51 -0.51 -5.77 -5.77 -5.77 -0.30 -0.30 -0.20
C |  0.67 -0.49  1.71 -0.76  0.89  0.18  0.37  0.31
G |  0.09  0.68 -5.19  1.62  0.98  0.80  0.14  0.01
T | -0.21  0.07 -5.77 -5.77 -1.42 -0.76 -0.08 -0.03
03 / EXPERIMENTAL CONTEXT
Gene-level annotations and interactions.
Genes bound in ChIP-chip experiments 1 genes
No Data
Genes affected by TF deletion 1 genes
No Data
Genes supported by both experiments 1 genes
No Data
Predicted TF–TF partners 20 genes
CAT8, GCN4, GIS1, GSM1, HAP2, HAP4, IME1, MSN4, NHP10, NRG1, PDR1, RDR1, RGM1, RTG3, SKN7, STP1, SUT1, UME6, USV1, YER184C