RPH1
YER169W, KDM4
JmjC domain-containing histone demethylase which can specifically demethylate H3K36 tri- and dimethyl modification states; transcriptional repressor of PHR1; Rph1p phosphorylation during DNA damage is under control of the MEC1-RAD53 pathway
Best-performing DNA-binding model.
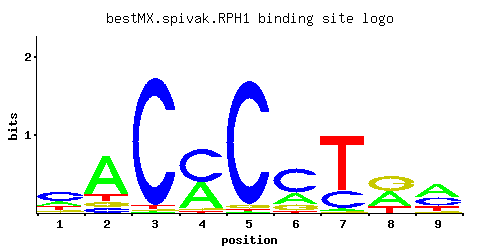
View and copy the recommended matrices ↘
A | 0.206 0.710 0.010 0.408 0.010 0.245 0.032 0.399 0.459
C | 0.504 0.086 0.961 0.550 0.953 0.592 0.236 0.010 0.328
G | 0.105 0.086 0.010 0.032 0.028 0.136 0.010 0.424 0.044
T | 0.184 0.119 0.019 0.010 0.010 0.027 0.722 0.167 0.170
A |  20  71   1  40   1  24   3  39  45
C |  50   8  96  55  95  59  23   1  32
G |  10   8   1   3   2  13   1  42   4
T |  18  11   1   1   1   2  72  16  17
A | -0.44  0.80 -3.47  0.24 -3.47 -0.27 -2.30  0.22  0.36
C |  1.03 -0.74  1.68  1.12  1.67  1.19  0.27 -2.89  0.60
G | -0.54 -0.74 -2.89 -1.73 -1.86 -0.28 -2.89  0.86 -1.41
T | -0.55 -0.99 -2.82 -3.47 -3.47 -2.47  0.81 -0.65 -0.63
Alternative candidate matrices 9
Historical matrix candidates from the original ScerTF database. Expand a source to inspect its original logo, scores, and matrix values.
RPH1Badis et. al.P = 0.001065View matrix ↘
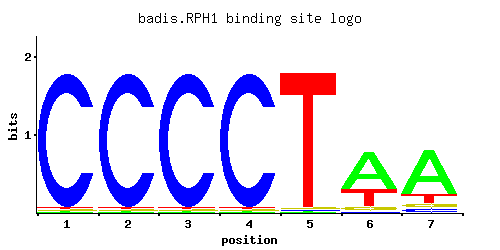
A | 0.01 0.01 0.01 0.01 0.01 0.63 0.73
C | 0.97 0.97 0.97 0.97 0.01 0.01 0.07
G | 0.01 0.01 0.01 0.01 0.01 0.07 0.07
T | 0.01 0.01 0.01 0.01 0.97 0.29 0.13
A |   1   1   1   1   1  63  73
C |  97  97  97  97   1   1   7
G |   1   1   1   1   1   7   7
T |   1   1   1   1  97  28  13
A | -3.47 -3.47 -3.47 -3.47 -3.47  0.68  0.82
C |  1.68  1.68  1.68  1.68 -2.89 -2.89 -0.94
G | -2.89 -2.89 -2.89 -2.89 -2.89 -0.94 -0.94
T | -3.47 -3.47 -3.47 -3.47  1.11 -0.10 -0.90
RPH1_AFoat et. al.P = 7.77e-08View matrix ↘
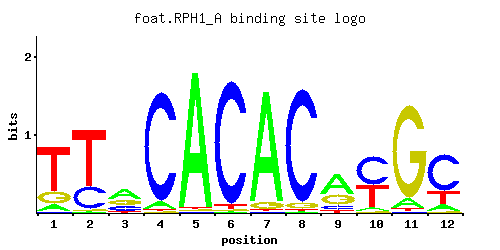
A | 0.10 0.01 0.44 0.06 0.97 0.01 0.92 0.01 0.55 0.06 0.09 0.11
C | 0.01 0.28 0.24 0.92 0.01 0.95 0.01 0.93 0.11 0.53 0.01 0.66
G | 0.19 0.01 0.27 0.01 0.01 0.01 0.06 0.05 0.30 0.01 0.88 0.01
T | 0.70 0.71 0.05 0.01 0.01 0.03 0.01 0.01 0.05 0.41 0.02 0.22
A |  10   1  44   6  97   1  92   1  55   6   9  11
C |   1  28  24  92   1  95   1  93  11  53   1  66
G |  19   1  27   1   1   1   6   5  30   1  88   1
T |  70  71   5   1   1   3   1   1   5  41   2  22
A | -1.16 -3.47  0.32 -1.67  1.11 -3.47  1.06 -3.47  0.54 -1.67 -1.27 -1.07
C | -2.89  0.44  0.29  1.63 -2.89  1.66 -2.89  1.64 -0.49  1.08 -2.89  1.30
G |  0.05 -2.89  0.41 -2.89 -2.89 -2.89 -1.10 -1.28  0.51 -2.89  1.59 -2.89
T |  0.78  0.80 -1.86 -3.47 -3.47 -2.37 -3.47 -3.47 -1.86  0.25 -2.77 -0.37
RPH1_BFoat et. al.P = 0.2069View matrix ↘
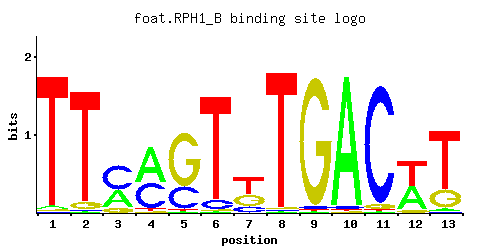
A | 0.02 0.01 0.36 0.56 0.01 0.01 0.01 0.01 0.01 0.96 0.01 0.45 0.02
C | 0.01 0.01 0.53 0.41 0.29 0.08 0.19 0.01 0.02 0.02 0.95 0.01 0.01
G | 0.01 0.06 0.10 0.01 0.70 0.01 0.33 0.01 0.96 0.01 0.04 0.07 0.24
T | 0.96 0.92 0.01 0.03 0.01 0.90 0.47 0.97 0.01 0.01 0.01 0.48 0.74
A |   2   1  36  56   1   1   1   1   1  96   1  45   2
C |   1   1  53  41  28   8  19   1   2   2  95   1   1
G |   1   6  10   1  70   1  33   1  96   1   4   7  24
T |  96  92   1   3   1  90  47  97   1   1   1  48  74
A | -2.77 -3.47  0.12  0.56 -3.47 -3.47 -3.47 -3.47 -3.47  1.10 -3.47  0.34 -2.77
C | -2.89 -2.89  1.08  0.82  0.48 -0.81  0.05 -2.89 -2.20 -2.20  1.66 -2.89 -2.89
G | -2.89 -1.10 -0.59 -2.89  1.36 -2.89  0.61 -2.89  1.67 -2.89 -1.50 -0.94  0.29
T |  1.10  1.06 -3.47 -2.37 -3.47  1.03  0.38  1.11 -3.47 -3.47 -3.47  0.41  0.84
RPH1_CFoat et. al.P = 0.2143View matrix ↘
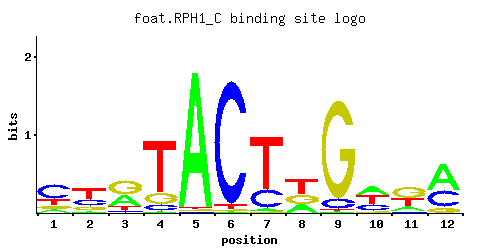
A | 0.01 0.29 0.35 0.01 0.45 0.71 0.03 0.01 0.74 0.10 0.46 0.21
C | 0.10 0.47 0.03 0.89 0.30 0.01 0.01 0.01 0.16 0.50 0.18 0.12
G | 0.35 0.06 0.25 0.09 0.01 0.25 0.96 0.01 0.09 0.07 0.30 0.55
T | 0.54 0.17 0.37 0.01 0.25 0.03 0.01 0.97 0.01 0.33 0.06 0.12
A |   1  28  35   1  45  71   3   1  74  10  46  21
C |  10  47   3  89  30   1   1   1  16  50  18  12
G |  35   6  25   9   1  25  96   1   9   7  30  55
T |  54  17  37   1  25   3   1  97   1  33   6  12
A | -3.47 -0.10  0.09 -3.47  0.34  0.80 -2.37 -3.47  0.84 -1.16  0.36 -0.42
C | -0.59  0.96 -1.79  1.60  0.51 -2.89 -2.89 -2.89 -0.12  1.02  0.00 -0.41
G |  0.66 -1.10  0.33 -0.69 -2.89  0.33  1.67 -2.89 -0.69 -0.94  0.51  1.12
T |  0.52 -0.63  0.15 -3.47 -0.25 -2.37 -3.47  1.11 -3.47  0.03 -1.67 -0.98
RPH1_DFoat et. al.P = 0.5853View matrix ↘
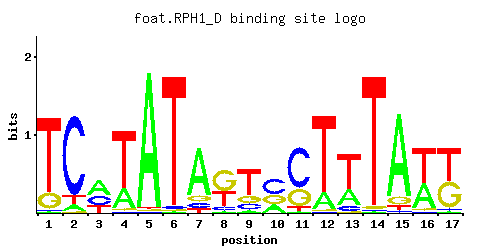
A | 0.53 0.56 0.04 0.96 0.63 0.81 0.06 0.01 0.63 0.35 0.07 0.96 0.01 0.73 0.24 0.08 0.81
C | 0.43 0.03 0.08 0.02 0.01 0.01 0.28 0.29 0.17 0.52 0.10 0.01 0.01 0.02 0.01 0.01 0.18
G | 0.03 0.01 0.02 0.01 0.09 0.01 0.66 0.46 0.15 0.11 0.08 0.02 0.01 0.01 0.30 0.84 0.01
T | 0.01 0.40 0.85 0.01 0.27 0.17 0.01 0.24 0.05 0.02 0.74 0.01 0.97 0.24 0.46 0.06 0.01
A |  53  56   4  96  63  81   6   1  63  35   7  96   1  73  24   8  81
C |  43   3   8   2   1   1  28  28  17  52  10   1   1   2   1   1  18
G |   3   1   2   1   9   1  66  46  15  11   8   2   1   1  30  84   1
T |   1  40  85   1  27  17   1  24   5   2  74   1  97  24  46   6   1
A |  0.50  0.56 -2.08  1.10  0.68  0.93 -1.67 -3.47  0.68  0.09 -1.52  1.10 -3.47  0.82 -0.29 -1.39  0.93
C |  0.87 -1.79 -0.81 -2.20 -2.89 -2.89  0.44  0.48 -0.06  1.06 -0.59 -2.89 -2.89 -2.20 -2.89 -2.89  0.00
G | -1.79 -2.89 -2.20 -2.89 -0.69 -2.89  1.30  0.94 -0.18 -0.49 -0.81 -2.20 -2.89 -2.89  0.51  1.54 -2.89
T | -3.47  0.22  0.98 -3.47 -0.17 -0.63 -3.47 -0.29 -1.86 -2.77  0.84 -3.47  1.11 -0.29  0.36 -1.67 -3.47
RPH1Harbison et. al.P = 0.2294View matrix ↘
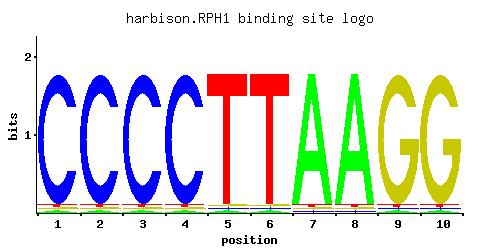
A | 0.012 0.012 0.012 0.012 0.012 0.012 0.965 0.965 0.012 0.012
C | 0.965 0.965 0.965 0.965 0.012 0.012 0.012 0.012 0.012 0.012
G | 0.012 0.012 0.012 0.012 0.012 0.012 0.012 0.012 0.965 0.965
T | 0.012 0.012 0.012 0.012 0.965 0.965 0.012 0.012 0.012 0.012
A |   1   1   1   1   1   1  96  96   1   1
C |  96  96  96  96   1   1   1   1   1   1
G |   1   1   1   1   1   1   1   1  96  96
T |   1   1   1   1  96  96   1   1   1   1
A | -3.28 -3.28 -3.28 -3.28 -3.28 -3.28  1.10  1.10 -3.28 -3.28
C |  1.68  1.68  1.68  1.68 -2.71 -2.71 -2.71 -2.71 -2.71 -2.71
G | -2.71 -2.71 -2.71 -2.71 -2.71 -2.71 -2.71 -2.71  1.68  1.68
T | -3.28 -3.28 -3.28 -3.28  1.10  1.10 -3.28 -3.28 -3.28 -3.28
RPH1Macisaac et. alP = 0.2294View matrix ↘
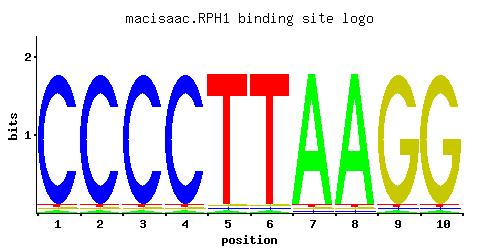
A | 0.012 0.012 0.012 0.012 0.012 0.012 0.964 0.964 0.012 0.012
C | 0.964 0.964 0.964 0.964 0.012 0.012 0.012 0.012 0.012 0.012
G | 0.012 0.012 0.012 0.012 0.012 0.012 0.012 0.012 0.964 0.964
T | 0.012 0.012 0.012 0.012 0.964 0.964 0.012 0.012 0.012 0.012
A |   1   1   1   1   1   1  96  96   1   1
C |  96  96  96  96   1   1   1   1   1   1
G |   1   1   1   1   1   1   1   1  96  96
T |   1   1   1   1  96  96   1   1   1   1
A | -3.28 -3.28 -3.28 -3.28 -3.28 -3.28  1.10  1.10 -3.28 -3.28
C |  1.68  1.68  1.68  1.68 -2.71 -2.71 -2.71 -2.71 -2.71 -2.71
G | -2.71 -2.71 -2.71 -2.71 -2.71 -2.71 -2.71 -2.71  1.68  1.68
T | -3.28 -3.28 -3.28 -3.28  1.10  1.10 -3.28 -3.28 -3.28 -3.28
RPH1Zhu et. al.P = 0.09329View matrix ↘
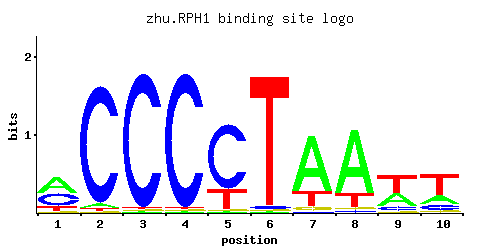
A | 0.57 0.48 0.17 0.20 0.96 0.22 0.01 0.01 0.02 0.11
C | 0.05 0.03 0.03 0.05 0.01 0.01 0.01 0.01 0.01 0.04
G | 0.13 0.12 0.02 0.01 0.02 0.76 0.97 0.97 0.94 0.38
T | 0.24 0.36 0.79 0.74 0.01 0.01 0.01 0.01 0.03 0.47
A |  56  48  17  20  96  22   1   1   2  11
C |   5   3   3   5   1   1   1   1   1   4
G |  13  12   2   1   2  76  97  97  94  38
T |  24  36  79  74   1   1   1   1   3  47
A |  0.58  0.41 -0.63 -0.47  1.10 -0.37 -3.47 -3.47 -2.77 -1.07
C | -1.28 -1.79 -1.79 -1.28 -2.89 -2.89 -2.89 -2.89 -2.89 -1.50
G | -0.33 -0.41 -2.20 -2.89 -2.20  1.44  1.68  1.68  1.65  0.75
T | -0.29  0.12  0.90  0.84 -3.47 -3.47 -3.47 -3.47 -2.37  0.38
RPH1Zhao and StormoP = 0.003682View matrix ↘
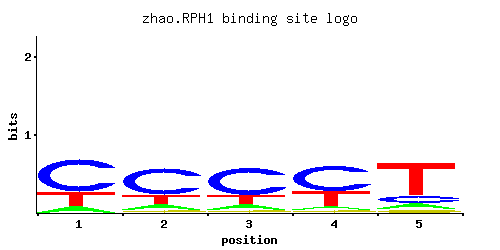
A | 0.671 0.323 0.187 0.200 0.261
C | 0.074 0.037 0.051 0.053 0.003
G | 0.154 0.572 0.641 0.631 0.612
T | 0.100 0.068 0.121 0.115 0.124
A |  67  32  18  20  26
C |   7   3   5   5   0
G |  15  57  64  63  61
T |  10   6  12  11  12
A |  0.74  0.01 -0.54 -0.47 -0.20
C | -0.89 -1.58 -1.26 -1.22 -4.09
G | -0.16  1.16  1.27  1.25  1.22
T | -1.16 -1.55 -0.97 -1.02 -0.95
Gene-level annotations and interactions.
Genes bound in ChIP-chip experiments 24 genes
YBL022C, YBL072C, YBR033W, YBR036C, YBR056W, YBR126C, YCL057W, YCL058C, YCL074W, YDL120W, YDL121C, YDL191W, YDR098C, YDR428C, YDR449C, YDR450W, YFR009W, YHR136C, YHR137W, YKR062W, YLR336C, YLR338W, YOL026C, YOL121C
Genes affected by TF deletion 186 genes
YBR006W, YJR016C, YLR274W, YLR218C, YLR248W, YGL009C, YHR113W, YHR146W, YKL043W, YLR060W, YOR377W, YDR207C, YKR076W, YMR040W, YOL048C, YPL206C, YPL240C, YAL008W, YOR038C, YPL016W, YPR138C, YLR309C, YMR071C, YNL115C, YNL149C, YOR285W, YOR317W, YOR291W, YER028C, YER058W, YGR244C, YLR156W, YNL333W, YNL305C, YBR093C, YBR129C, YGR062C, YHR024C, YLR304C, YOL073C, YOL076W, YOL105C, YPR047W, YBL024W, YBR288C, YDR281C, YDR313C, YER057C, YGR211W, YLR155C, YLR157C, YNL332W, YNL306W, YIL156W, YML121W, YAL043C, YMR173W, YPL059W, YPL160W, YER119C, YIL085C, YNR066C, YOR228C, YOR260W, YOR198C, YPL246C, YAR002W, YBR166C, YGR131W, YKL087C, YLR099C, YMR171C, YNL214W, YPL054W, YIR036C, YLL009C, YLR346C, YDR347W, YHR215W, YKL149C, YPL122C, YPL154C, YBR101C, YBR105C, YDL040C, YGR012W, YIR037W, YIR010W, YJR156C, YLL041C, YMR083W, YNL184C, YOL083W, YOR292C, YBL065W, YBR264C, YER062C, YGL112C, YLR159W, YLR161W, YMR317W, YMR321C, YNR034W, YNR038W, YPL091W, YPL123C, YCR061W, YNL065W, YOR209C, YDR345C, YAL023C, YBR241C, YJL067W, YKL058W, YLR290C, YML130C, YNL037C, YAL049C, YJL066C, YJL068C, YKL120W, YPL032C, YDL021W, YFL059W, YGR019W, YLR324W, YLR356W, YOR383C, YGR232W, YLR136C, YPL132W, YDR115W, YNL160W, YOR330C, YPR067W, YER044C, YGR261C, YGR231C, YHL004W, YHR016C, YJR044C, YKR065C, YLR297W, YOR215C, YOR217W, YBR185C, YJL143W, YKL066W, YKL103C, YMR182C, YMR186W, YNL269W, YPR159W, YBR053C, YMR034C, YOL071W, YAL030W, YBR244W, YDR211W, YGL032C, YGR149W, YHR135C, YHR137W, YHR140W, YHR171W, YLR047C, YLR115W, YMR181C, YPL075W, YPR038W, YGR270W, YIL070C, YKL192C, YLR174W, YML110C, YPL172C, YMR157C, YNL200C, YOR306C, YPR037C, YJL200C, YKR001C, YLR173W, YNL007C, YMR307W, YNR017W
Genes supported by both experiments 1 genes
YHR137W
Predicted TF–TF partners 10 genes
GIS1, MIG1, MIG3, MSN2, MSN4, RGM1, RSF2, SUT1, USV1, YER184C