RLM1
YPL089C
MADS-box transcription factor, component of the protein kinase C-mediated MAP kinase pathway involved in the maintenance of cell integrity; phosphorylated and activated by the MAP-kinase Slt2p
Best-performing DNA-binding model.
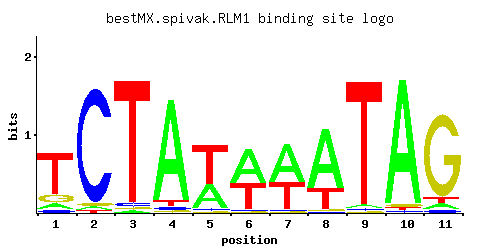
View and copy the recommended matrices ↘
A | 0.090 0.021 0.012 0.905 0.368 0.545 0.574 0.728 0.025 0.952 0.051
C | 0.055 0.935 0.029 0.028 0.024 0.024 0.018 0.011 0.015 0.012 0.034
G | 0.138 0.028 0.012 0.017 0.012 0.015 0.011 0.011 0.011 0.024 0.863
T | 0.718 0.015 0.948 0.050 0.595 0.417 0.396 0.249 0.949 0.012 0.051
A |   9   2   1  90  36  54  57  72   2  95   5
C |   5  93   2   2   2   2   1   1   1   1   3
G |  13   2   1   1   1   1   1   1   1   2  86
T |  71   1  94   5  59  41  39  24  94   1   5
A | -1.27 -2.72 -3.28  1.04  0.14  0.53  0.58  0.82 -2.55  1.09 -1.84
C | -1.19  1.65 -1.83 -1.86 -2.01 -2.01 -2.30 -2.80 -2.48 -2.71 -1.67
G | -0.27 -1.86 -2.71 -2.36 -2.71 -2.48 -2.80 -2.80 -2.80 -2.01  1.57
T |  0.81 -3.06  1.09 -1.86  0.62  0.26  0.21 -0.25  1.09 -3.28 -1.84
Alternative candidate matrices 7
Historical matrix candidates from the original ScerTF database. Expand a source to inspect its original logo, scores, and matrix values.
RLM1_AFoat et. al.P = 1View matrix ↘
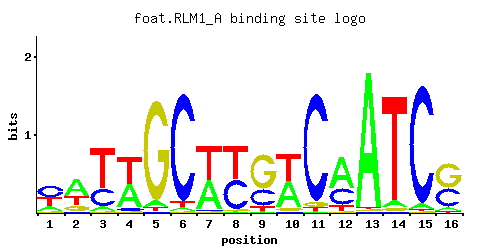
A | 0.15 0.52 0.06 0.43 0.06 0.03 0.45 0.01 0.01 0.46 0.01 0.59 0.97 0.05 0.04 0.07
C | 0.46 0.04 0.28 0.06 0.01 0.93 0.02 0.47 0.29 0.01 0.93 0.31 0.01 0.01 0.94 0.38
G | 0.06 0.16 0.01 0.01 0.91 0.01 0.01 0.02 0.63 0.05 0.04 0.01 0.01 0.03 0.01 0.52
T | 0.33 0.28 0.65 0.51 0.03 0.04 0.53 0.51 0.08 0.48 0.03 0.09 0.01 0.91 0.01 0.02
A |  15  52   6  43   6   3  45   1   1  46   1  59  97   5   4   7
C |  46   4  28   6   1  93   2  47  28   1  93  31   1   1  94  38
G |   6  16   1   1  91   1   1   2  63   5   4   1   1   3   1  52
T |  33  28  65  51   3   4  53  51   8  48   3   9   1  91   1   2
A | -0.76  0.49 -1.67  0.30 -1.67 -2.37  0.34 -3.47 -3.47  0.36 -3.47  0.61  1.11 -1.86 -2.08 -1.52
C |  0.94 -1.50  0.44 -1.10 -2.89  1.64 -2.20  0.96  0.48 -2.89  1.64  0.54 -2.89 -2.89  1.65  0.75
G | -1.10 -0.12 -2.89 -2.89  1.62 -2.89 -2.89 -2.20  1.25 -1.28 -1.50 -2.89 -2.89 -1.79 -2.89  1.06
T |  0.03 -0.13  0.71  0.47 -2.37 -2.08  0.50  0.47 -1.39  0.41 -2.37 -1.27 -3.47  1.05 -3.47 -2.77
RLM1_BFoat et. al.P = 0.1476View matrix ↘
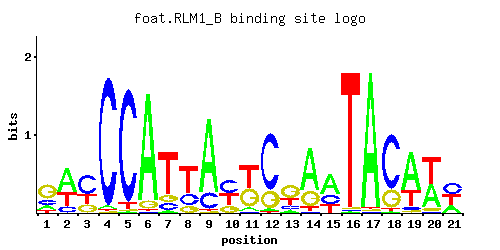
A | 0.16 0.55 0.01 0.02 0.01 0.92 0.04 0.01 0.80 0.01 0.06 0.03 0.08 0.68 0.53 0.01 0.97 0.01 0.65 0.42 0.25
C | 0.21 0.14 0.52 0.96 0.93 0.01 0.12 0.25 0.18 0.42 0.03 0.74 0.14 0.01 0.26 0.01 0.01 0.73 0.05 0.01 0.38
G | 0.54 0.01 0.23 0.01 0.01 0.07 0.12 0.15 0.01 0.23 0.41 0.22 0.52 0.25 0.01 0.01 0.01 0.24 0.03 0.06 0.01
T | 0.08 0.31 0.24 0.01 0.05 0.01 0.72 0.59 0.01 0.35 0.50 0.01 0.25 0.07 0.21 0.97 0.01 0.03 0.26 0.50 0.36
A |  16  55   1   2   1  92   4   1  80   1   6   3   8  68  53   1  97   1  65  42  25
C |  21  14  52  96  93   1  12  25  18  42   3  74  14   1  26   1   1  73   5   1  38
G |  54   1  23   1   1   7  12  15   1  23  41  22  52  25   1   1   1  24   3   6   1
T |   8  31  24   1   5   1  72  59   1  35  50   1  25   7  21  97   1   3  26  50  36
A | -0.69  0.54 -3.47 -2.77 -3.47  1.06 -2.08 -3.47  0.92 -3.47 -1.67 -2.37 -1.39  0.75  0.50 -3.47  1.11 -3.47  0.71  0.27 -0.25
C |  0.15 -0.25  1.06  1.67  1.64 -2.89 -0.41  0.33  0.00  0.85 -1.79  1.41 -0.25 -2.89  0.37 -2.89 -2.89  1.40 -1.28 -2.89  0.75
G |  1.10 -2.89  0.25 -2.89 -2.89 -0.94 -0.41 -0.18 -2.89  0.25  0.82  0.20  1.06  0.33 -2.89 -2.89 -2.89  0.29 -1.79 -1.10 -2.89
T | -1.39 -0.03 -0.29 -3.47 -1.86 -3.47  0.81  0.61 -3.47  0.09  0.45 -3.47 -0.25 -1.52 -0.42  1.11 -3.47 -2.37 -0.21  0.45  0.12
RLM1Harbison et. al.P = 7.16e-12View matrix ↘
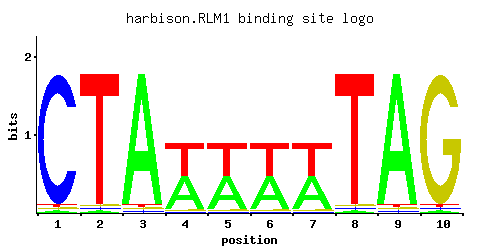
A | 0.012 0.012 0.965 0.488 0.488 0.488 0.488 0.012 0.965 0.012
C | 0.965 0.012 0.012 0.012 0.012 0.012 0.012 0.012 0.012 0.012
G | 0.012 0.012 0.012 0.012 0.012 0.012 0.012 0.012 0.012 0.965
T | 0.012 0.965 0.012 0.488 0.488 0.488 0.488 0.965 0.012 0.012
A |   1   1  96  48  48  48  48   1  96   1
C |  96   1   1   1   1   1   1   1   1   1
G |   1   1   1   1   1   1   1   1   1  96
T |   1  96   1  48  48  48  48  96   1   1
A | -3.28 -3.28  1.10  0.42  0.42  0.42  0.42 -3.28  1.10 -3.28
C |  1.68 -2.71 -2.71 -2.71 -2.71 -2.71 -2.71 -2.71 -2.71 -2.71
G | -2.71 -2.71 -2.71 -2.71 -2.71 -2.71 -2.71 -2.71 -2.71  1.68
T | -3.28  1.10 -3.28  0.42  0.42  0.42  0.42  1.10 -3.28 -3.28
RLM1Macisaac et. alP = 1.83e-10View matrix ↘
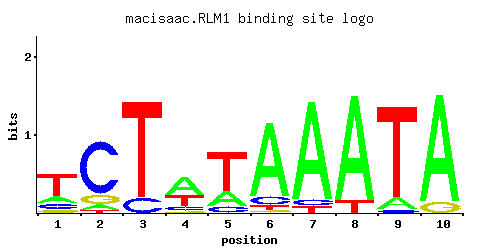
A | 0.002 0.866 0.107 0.052 0.048 0.654 0.305 0.860 0.031 0.609
C | 0.098 0.001 0.001 0.001 0.024 0.003 0.038 0.001 0.132 0.077
G | 0.002 0.029 0.001 0.056 0.095 0.101 0.132 0.138 0.761 0.143
T | 0.898 0.104 0.891 0.891 0.833 0.242 0.525 0.001 0.076 0.171
A |   0  86  10   5   4  65  30  86   3  60
C |   9   0   0   0   2   0   3   0  13   7
G |   0   2   0   5   9  10  13  13  76  14
T |  89  10  89  89  83  24  52   0   7  17
A | -5.08  1.00 -1.10 -1.82 -1.90  0.71 -0.05  0.99 -2.33  0.64
C | -0.61 -5.19 -5.19 -5.19 -2.01 -4.09 -1.56 -5.19 -0.31 -0.85
G | -4.50 -1.83 -5.19 -1.17 -0.64 -0.58 -0.31 -0.27  1.44 -0.23
T |  1.03 -1.12  1.02  1.02  0.96 -0.28  0.50 -5.77 -1.44 -0.63
RLM1Morozov et. al.P = 5.14e-11View matrix ↘
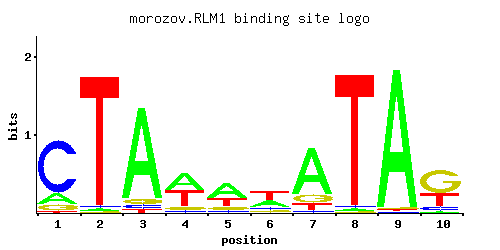
A | 0.298 0.008 0.962 0.101 0.436 0.265 0.419 0.028 0.962 0.015
C | 0.566 0.009 0.005 0.128 0.101 0.109 0.071 0.051 0.010 0.084
G | 0.106 0.008 0.016 0.035 0.133 0.094 0.054 0.038 0.015 0.751
T | 0.030 0.975 0.016 0.737 0.330 0.533 0.456 0.883 0.014 0.150
A |  29   0  96  10  43  26  41   2  96   1
C |  56   0   0  12  10  10   7   5   1   8
G |  10   0   1   3  13   9   5   3   1  75
T |   3  97   1  73  33  53  45  88   1  15
A | -0.07 -3.69  1.10 -1.15  0.31 -0.19  0.27 -2.44  1.10 -3.06
C |  1.15 -3.00 -3.58 -0.34 -0.58 -0.50 -0.93 -1.26 -2.89 -0.76
G | -0.53 -3.11 -2.42 -1.64 -0.30 -0.65 -1.20 -1.56 -2.48  1.43
T | -2.37  1.11 -3.00  0.83  0.03  0.51  0.35  1.02 -3.13 -0.76
RLM1Pachkov et alP = 7.86e-05View matrix ↘
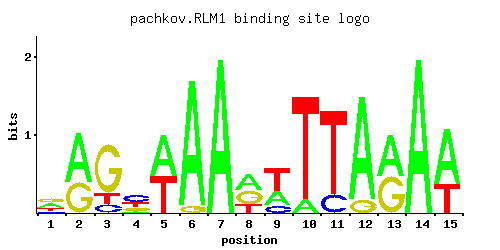
A | 0.340 0.614 0.001 0.092 0.526 0.945 1.000 0.416 0.311 0.112 0.001 0.888 0.526 1.000 0.657
C | 0.125 0.001 0.125 0.461 0.001 0.001 0.001 0.001 0.171 0.001 0.182 0.001 0.001 0.001 0.001
G | 0.371 0.386 0.723 0.211 0.001 0.055 0.001 0.367 0.001 0.001 0.001 0.112 0.474 0.001 0.001
T | 0.164 0.001 0.152 0.236 0.474 0.001 0.001 0.217 0.518 0.888 0.818 0.001 0.001 0.001 0.343
A |  34  61   0   9  52  94 100  41  31  11   0  88  52 100  65
C |  12   0  12  46   0   0   0   0  17   0  18   0   0   0   0
G |  37  38  72  21   0   5   0  36   0   0   0  11  47   0   0
T |  16   0  15  23  47   0   0  21  51  88  81   0   0   0  34
A |  0.06  0.65 -5.77 -1.25  0.50  1.08  1.14  0.26 -0.03 -1.05 -5.77  1.02  0.50  1.14  0.72
C | -0.36 -5.19 -0.36  0.94 -5.19 -5.19 -5.19 -5.19 -0.05 -5.19  0.01 -5.19 -5.19 -5.19 -5.19
G |  0.72  0.76  1.39  0.16 -5.19 -1.19 -5.19  0.71 -5.19 -5.19 -5.19 -0.47  0.97 -5.19 -5.19
T | -0.67 -5.77 -0.74 -0.30  0.39 -5.77 -5.77 -0.39  0.48  1.02  0.94 -5.77 -5.77 -5.77  0.07
RLM1Zhu J and MQ ZhangP = 1.54e-09View matrix ↘
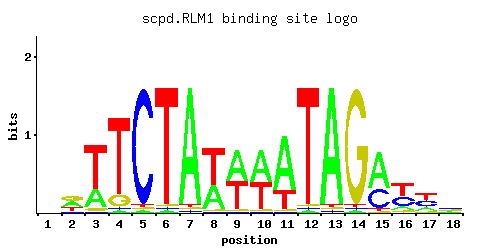
A | 0.26 0.33 0.26 0.02 0.02 0.02 0.93 0.37 0.50 0.52 0.72 0.02 0.93 0.02 0.61 0.11 0.17 0.25
C | 0.26 0.07 0.02 0.02 0.93 0.02 0.02 0.02 0.02 0.02 0.02 0.02 0.02 0.02 0.33 0.36 0.37 0.32
G | 0.26 0.37 0.04 0.13 0.02 0.02 0.02 0.02 0.02 0.02 0.02 0.02 0.02 0.93 0.02 0.07 0.09 0.25
T | 0.21 0.24 0.67 0.83 0.02 0.93 0.02 0.59 0.46 0.43 0.24 0.93 0.02 0.02 0.04 0.47 0.37 0.18
A |  26  33  26   2   2   2  93  37  50  52  72   2  93   2  61  11  17  25
C |  26   7   2   2  93   2   2   2   2   2   2   2   2   2  33  36  37  32
G |  26  37   4  13   2   2   2   2   2   2   2   2   2  93   2   7   9  25
T |  21  24  67  83   2  93   2  59  46  43  24  93   2   2   4  47  37  18
A | -0.21  0.03 -0.21 -2.77 -2.77 -2.77  1.07  0.15  0.45  0.49  0.81 -2.77  1.07 -2.77  0.65 -1.07 -0.63 -0.25
C |  0.37 -0.94 -2.20 -2.20  1.64 -2.20 -2.20 -2.20 -2.20 -2.20 -2.20 -2.20 -2.20 -2.20  0.61  0.69  0.72  0.58
G |  0.37  0.72 -1.50 -0.33 -2.20 -2.20 -2.20 -2.20 -2.20 -2.20 -2.20 -2.20 -2.20  1.64 -2.20 -0.94 -0.69  0.33
T | -0.42 -0.29  0.74  0.95 -2.77  1.07 -2.77  0.61  0.36  0.30 -0.29  1.07 -2.77 -2.77 -2.08  0.38  0.15 -0.58
Gene-level annotations and interactions.
Genes bound in ChIP-chip experiments 120 genes
YBL001C, YBR057C, YBR156C, YBR158W, YBR159W, YCL019W, YCL020W, YCL022C, YCL023C, YCR018C-A, YCR019W, YCR024C, YDL037C, YDL044C, YDL245C, YDL246C, YDL247W, YDR042C, YDR054C, YDR055W, YDR072C, YDR073W, YDR077W, YDR085C, YDR210W-D, YDR279W, YDR283C, YDR309C, YDR372C, YDR373W, YDR417C, YDR419W, YDR420W, YDR524C, YDR525W, YDR526C, YEL001C, YEL040W, YEL050C, YEL070W, YER001W, YER111C, YER112W, YER130C, YER131W, YER138C, YFR001W, YGL009C, YGL158W, YGL195W, YGL259W, YGR107W, YGR189C, YGR191W, YGR218W, YHL027W, YHL034C, YHL041W, YHR143W, YHR143W-A, YHR193C, YHR194W, YIL040W, YIL119C, YIL122W, YJL104W, YJL106W, YJL107C, YJL108C, YJL148W, YJL158C, YJL159W, YJR158W, YJR159W, YKL039W, YKL040C, YKL072W, YKL096W, YKL161C, YKL163W, YKL177W, YKL179C, YKR091W, YKR102W, YKR103W, YLL027W, YLR035C-A, YLR105C, YLR110C, YLR111W, YLR154C, YLR300W, YLR332W, YLR342W, YLR354C, YLR368W, YLR390W-A, YLR413W, YLR463C, YLR465C, YLR467W, YML055W, YML056C, YML124C, YMR013C, YMR014W, YMR049C, YNL066W, YNR050C, YOL159C, YOL160W, YOR058C, YOR108W, YOR236W, YOR268C, YOR269W, YOR315W, YOR355W, YPR195C, YPR197C
Genes affected by TF deletion 20 genes
YNL276C, YFR006W, YOR290C, YPL089C, YLR155C, YLR157C, YEL023C, YLR099C, YLR101C, YBL031W, YLR158C, YLR160C, YJR152W, YLR258W, YLR294C, YOL122C, YDR174W, YLR112W, YDR395W, YKR062W