RGT1
YKL038W
Glucose-responsive transcription factor that regulates expression of several glucose transporter (HXT) genes in response to glucose; binds to promoters and acts both as a transcriptional activator and repressor
Best-performing DNA-binding model.
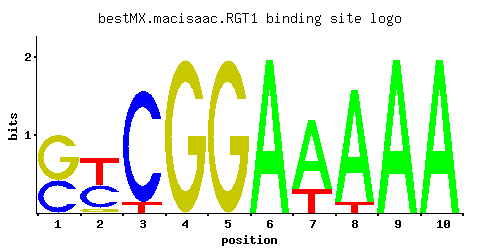
View and copy the recommended matrices ↘
A | 0.001 0.001 0.001 0.001 0.001 0.997 0.749 0.915 0.997 0.997
C | 0.416 0.417 0.915 0.001 0.001 0.001 0.001 0.001 0.001 0.001
G | 0.582 0.083 0.001 0.997 0.997 0.001 0.001 0.001 0.001 0.001
T | 0.001 0.500 0.083 0.001 0.001 0.001 0.250 0.083 0.001 0.001
A |   0   0   0   0   0  99  74  91  99  99
C |  41  41  91   0   0   0   0   0   0   0
G |  58   8   0  99  99   0   0   0   0   0
T |   0  50   8   0   0   0  25   8   0   0
A | -5.77 -5.77 -5.77 -5.77 -5.77  1.14  0.85  1.05  1.14  1.14
C |  0.84  0.84  1.63 -5.19 -5.19 -5.19 -5.19 -5.19 -5.19 -5.19
G |  1.17 -0.77 -5.19  1.71  1.71 -5.19 -5.19 -5.19 -5.19 -5.19
T | -5.77  0.45 -1.35 -5.77 -5.77 -5.77 -0.25 -1.35 -5.77 -5.77
Alternative candidate matrices 7
Historical matrix candidates from the original ScerTF database. Expand a source to inspect its original logo, scores, and matrix values.
RGT1Badis et. al.P = 0.006004View matrix ↘
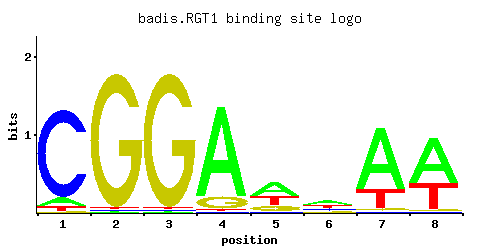
A | 0.36 0.22 0.27 0.30 0.01 0.01 0.01 0.04
C | 0.01 0.02 0.15 0.18 0.12 0.97 0.97 0.01
G | 0.01 0.01 0.17 0.04 0.01 0.01 0.01 0.87
T | 0.62 0.75 0.41 0.48 0.86 0.01 0.01 0.08
A |  36  22  27  30   1   1   1   4
C |   1   2  15  18  12  97  97   1
G |   1   1  17   4   1   1   1  87
T |  62  75  41  48  86   1   1   8
A |  0.12 -0.37 -0.17 -0.06 -3.47 -3.47 -3.47 -2.08
C | -2.89 -2.20 -0.18  0.00 -0.41  1.68  1.68 -2.89
G | -2.89 -2.89 -0.06 -1.50 -2.89 -2.89 -2.89  1.58
T |  0.66  0.85  0.25  0.41  0.99 -3.47 -3.47 -1.39
RGT1_AFoat et. al.P = 0.0005686View matrix ↘
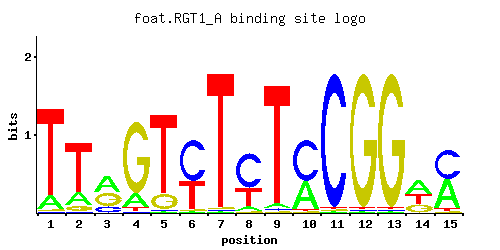
A | 0.13 0.19 0.44 0.15 0.01 0.01 0.01 0.07 0.03 0.39 0.01 0.01 0.01 0.43 0.48
C | 0.01 0.01 0.17 0.01 0.01 0.59 0.01 0.61 0.02 0.60 0.97 0.01 0.01 0.01 0.49
G | 0.01 0.08 0.38 0.82 0.16 0.01 0.01 0.01 0.01 0.01 0.01 0.97 0.97 0.26 0.01
T | 0.85 0.73 0.01 0.03 0.82 0.39 0.96 0.31 0.95 0.01 0.01 0.01 0.01 0.31 0.03
A |  13  19  44  15   1   1   1   7   3  39   1   1   1  43  48
C |   1   1  17   1   1  59   1  61   2  60  97   1   1   1  49
G |   1   8  38  82  16   1   1   1   1   1   1  97  97  26   1
T |  85  73   1   3  82  39  96  31  95   1   1   1   1  31   3
A | -0.90 -0.52  0.32 -0.76 -3.47 -3.47 -3.47 -1.52 -2.37  0.20 -3.47 -3.47 -3.47  0.30  0.41
C | -2.89 -2.89 -0.06 -2.89 -2.89  1.19 -2.89  1.22 -2.20  1.20  1.68 -2.89 -2.89 -2.89  1.00
G | -2.89 -0.81  0.75  1.52 -0.12 -2.89 -2.89 -2.89 -2.89 -2.89 -2.89  1.68  1.68  0.37 -2.89
T |  0.98  0.82 -3.47 -2.37  0.94  0.20  1.10 -0.03  1.09 -3.47 -3.47 -3.47 -3.47 -0.03 -2.37
RGT1_BFoat et. al.P = 0.09927View matrix ↘
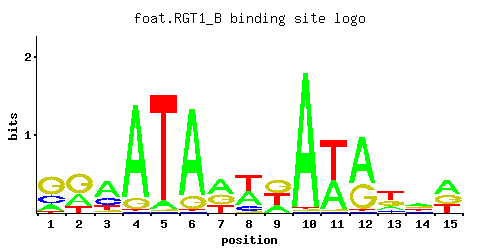
A | 0.25 0.22 0.45 0.01 0.58 0.01 0.35 0.44 0.22 0.01 0.91 0.01 0.13 0.17 0.03
C | 0.31 0.31 0.30 0.35 0.01 0.01 0.43 0.02 0.33 0.13 0.01 0.11 0.07 0.53 0.55
G | 0.01 0.14 0.09 0.01 0.01 0.01 0.01 0.15 0.01 0.01 0.01 0.01 0.27 0.01 0.23
T | 0.44 0.33 0.16 0.63 0.41 0.97 0.22 0.38 0.44 0.85 0.07 0.87 0.53 0.30 0.19
A |  25  22  45   1  57   1  35  44  22   1  91   1  13  17   3
C |  31  31  30  35   1   1  43   2  33  13   1  11   7  53  55
G |   1  14   9   1   1   1   1  15   1   1   1   1  27   1  23
T |  44  33  16  63  41  97  22  38  44  85   7  87  53  30  19
A | -0.25 -0.37  0.34 -3.47  0.59 -3.47  0.09  0.32 -0.37 -3.47  1.05 -3.47 -0.90 -0.63 -2.37
C |  0.54  0.54  0.51  0.66 -2.89 -2.89  0.87 -2.20  0.61 -0.33 -2.89 -0.49 -0.94  1.08  1.12
G | -2.89 -0.25 -0.69 -2.89 -2.89 -2.89 -2.89 -0.18 -2.89 -2.89 -2.89 -2.89  0.41 -2.89  0.25
T |  0.32  0.03 -0.69  0.68  0.25  1.11 -0.37  0.17  0.32  0.98 -1.52  1.00  0.50 -0.06 -0.52
RGT1Harbison et. al.P = 0.128View matrix ↘
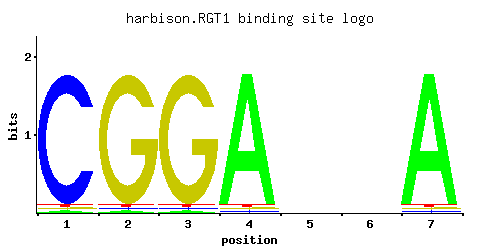
A | 0.012 0.012 0.012 0.965 0.250 0.250 0.965
C | 0.965 0.012 0.012 0.012 0.250 0.250 0.012
G | 0.012 0.965 0.965 0.012 0.250 0.250 0.012
T | 0.012 0.012 0.012 0.012 0.250 0.250 0.012
A |   1   1   1  96  25  25  96
C |  96   1   1   1  25  25   1
G |   1  96  96   1  25  25   1
T |   1   1   1   1  25  25   1
A | -3.28 -3.28 -3.28  1.10 -0.25 -0.25  1.10
C |  1.68 -2.71 -2.71 -2.71  0.33  0.33 -2.71
G | -2.71  1.68  1.68 -2.71  0.33  0.33 -2.71
T | -3.28 -3.28 -3.28 -3.28 -0.25 -0.25 -3.28
RGT1Pachkov et alP = 0.05694View matrix ↘
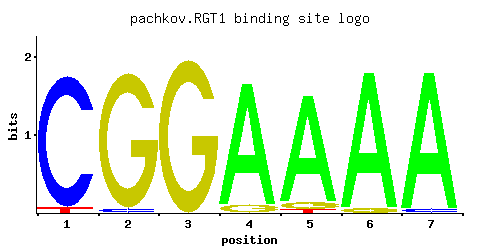
A | 0.001 0.001 0.030 0.001 0.001 0.001 0.039
C | 0.001 0.033 0.061 0.064 1.000 0.970 0.001
G | 0.031 0.001 0.001 0.001 0.001 0.030 0.961
T | 0.969 0.967 0.910 0.936 0.001 0.001 0.001
A |   0   0   3   0   0   0   3
C |   0   3   6   6 100  97   0
G |   3   0   0   0   0   3  96
T |  96  96  91  93   0   0   0
A | -5.77 -5.77 -2.37 -5.77 -5.77 -5.77 -2.10
C | -5.19 -1.70 -1.08 -1.03  1.71  1.68 -5.19
G | -1.76 -5.19 -5.19 -5.19 -5.19 -1.79  1.68
T |  1.11  1.11  1.05  1.07 -5.77 -5.77 -5.77
RGT1Zhu et. al.P = 5.55e-05View matrix ↘
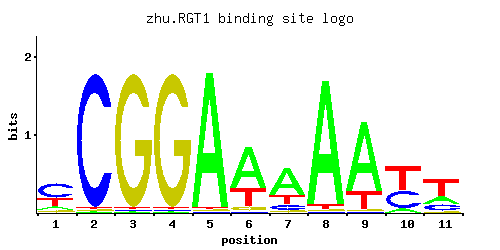
A | 0.12 0.01 0.01 0.01 0.97 0.66 0.63 0.95 0.78 0.10 0.23
C | 0.52 0.97 0.01 0.01 0.01 0.01 0.13 0.01 0.01 0.38 0.20
G | 0.08 0.01 0.97 0.97 0.01 0.06 0.05 0.01 0.01 0.01 0.04
T | 0.28 0.01 0.01 0.01 0.01 0.28 0.19 0.03 0.20 0.51 0.53
A |  12   1   1   1  97  66  63  95  78  10  23
C |  52  97   1   1   1   1  13   1   1  38  20
G |   8   1  97  97   1   6   5   1   1   1   4
T |  28   1   1   1   1  28  19   3  20  51  53
A | -0.98 -3.47 -3.47 -3.47  1.11  0.72  0.68  1.09  0.89 -1.16 -0.33
C |  1.06  1.68 -2.89 -2.89 -2.89 -2.89 -0.33 -2.89 -2.89  0.75  0.11
G | -0.81 -2.89  1.68  1.68 -2.89 -1.10 -1.28 -2.89 -2.89 -2.89 -1.50
T | -0.13 -3.47 -3.47 -3.47 -3.47 -0.13 -0.52 -2.37 -0.47  0.47  0.50
RGT1Zhao and StormoP = 0.002144View matrix ↘
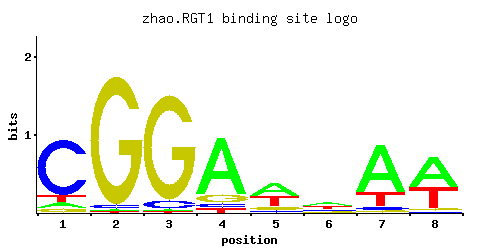
A | 0.074 0.008 0.013 0.778 0.469 0.369 0.716 0.553
C | 0.784 0.030 0.071 0.056 0.059 0.198 0.043 0.022
G | 0.057 0.958 0.909 0.112 0.131 0.137 0.034 0.043
T | 0.085 0.004 0.007 0.054 0.341 0.296 0.207 0.382
A |   7   0   1  77  46  36  71  55
C |  78   3   7   5   5  19   4   2
G |   5  95  90  11  13  13   3   4
T |   8   0   0   5  34  29  20  38
A | -1.46 -3.69 -3.20  0.89  0.38  0.14  0.81  0.55
C |  1.47 -1.79 -0.93 -1.17 -1.12  0.10 -1.43 -2.10
G | -1.15  1.67  1.62 -0.47 -0.32 -0.27 -1.67 -1.43
T | -1.33 -4.38 -3.82 -1.78  0.06 -0.08 -0.44  0.18
Gene-level annotations and interactions.
Genes bound in ChIP-chip experiments 37 genes
YBR001C, YDL063C, YDL189W, YDL190C, YER028C, YER029C, YER030W, YFR032C, YGL181W, YGL182C, YGL209W, YHR094C, YHR095W, YIL039W, YJL013C, YJL219W, YJL221C, YJR008W, YJR043C, YKL075C, YKL076C, YKL197C, YKR075C, YLL016W, YLR098C, YLR121C, YML051W, YNL247W, YNL248C, YOL156W, YOL157C, YOR167C, YOR168W, YOR170W, YOR232W, YPL130W, YPL172C
Genes affected by TF deletion 151 genes
YCR040W, YGR280C, YJR020W, YOR225W, YGL009C, YBR031W, YCR013C, YGR279C, YKR038C, YKR042W, YKR013W, YMR044W, YOR226C, YHR142W, YHR143W-A, YLR089C, YPL048W, YCR073W-A, YFR005C, YHR025W, YIR034C, YLR340W, YLR372W, YOR351C, YPL187W, YGR180C, YHR208W, YML085C, YNL337W, YBR067C, YDR461W, YHR026W, YJR117W, YLR339C, YNL110C, YNL146W, YOL073C, YPR013C, YPR015C, YCL012W, YCL018W, YIL015W, YML055W, YNL300W, YLR287C-A, YFR044C, YLR439W, YNL279W, YER152C, YER154W, YIL153W, YJR148W, YAL012W, YAL014C, YER001W, YOR040W, YDR502C, YFL018C, YLR380W, YOL144W, YOL086C, YPL195W, YBL062W, YBR265W, YDL198C, YGR192C, YKL209C, YKL178C, YPL092W, YHR094C, YIR004W, YLR343W, YLR349W, YMR083W, YOL111C, YOL143C, YOR221C, YBL032W, YJL158C, YKL177W, YKR093W, YMR057C, YOR239W, YHR190W, YLR040C, YLR420W, YPL033C, YCL066W, YHR005C-A, YKR086W, YML126C, YOR210W, YAL022C, YKL120W, YLR041W, YOR084W, YPR125W, YCR097W, YFL026W, YHR072W-A, YOL156W, YOL126C, YPR066W, YGL089C, YBR145W, YFL023W, YGR080W, YOR366W, YJR004C, YKL216W, YNR044W, YNL322C, YPL163C, YGL225W, YHL004W, YHL009W-A, YIL170W, YLR303W, YOR245C, YOR247W, YOR249C, YPL229W, YPL262W, YKL201C, YAR053W, YEL038W, YGR172C, YGR176W, YLR453C, YML019W, YOR093C, YOR063W, YDR285W, YLR302C, YNL045W, YOR246C, YOR248W, YGL032C, YBR118W, YFL037W, YLR019W, YOR034C, YCL009C, YDL184C, YGR274C, YJR009C, YKL164C, YLR180W, YMR276W, YKL038W, YER073W
Genes supported by both experiments 2 genes
YHR094C, YOL156W
Predicted TF–TF partners 8 genes
EDS1, GSM1, MIG1, MIG3, OAF1, PDR3, SUT1, YPR196W