PHD1
YKL043W
Transcriptional activator that enhances pseudohyphal growth; regulates expression of FLO11, an adhesin required for pseudohyphal filament formation; similar to StuA, an A. nidulans developmental regulator; potential Cdc28p substrate
Best-performing DNA-binding model.
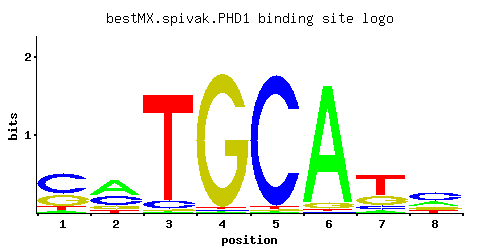
View and copy the recommended matrices ↘
A | 0.065 0.490 0.010 0.010 0.010 0.935 0.045 0.260
C | 0.563 0.330 0.070 0.010 0.965 0.010 0.125 0.470
G | 0.291 0.125 0.010 0.970 0.010 0.045 0.280 0.170
T | 0.080 0.055 0.910 0.010 0.015 0.010 0.550 0.100
A |   6  49   1   1   1  93   4  26
C |  56  33   7   1  96   1  12  47
G |  29  12   1  97   1   4  28  17
T |   8   5  91   1   1   1  55  10
A | -1.59  0.43 -3.47 -3.47 -3.47  1.07 -1.96 -0.21
C |  1.14  0.61 -0.94 -2.89  1.68 -2.89 -0.36  0.96
G |  0.48 -0.36 -2.89  1.68 -2.89 -1.39  0.44 -0.06
T | -1.39 -1.76  1.05 -3.47 -3.06 -3.47  0.54 -1.16
Alternative candidate matrices 8
Historical matrix candidates from the original ScerTF database. Expand a source to inspect its original logo, scores, and matrix values.
PHD1Badis et. al.P = 2.44e-17View matrix ↘
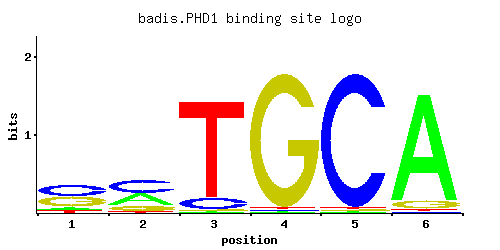
A | 0.09 0.37 0.01 0.01 0.01 0.91
C | 0.43 0.44 0.10 0.01 0.97 0.01
G | 0.39 0.15 0.01 0.97 0.01 0.07
T | 0.08 0.03 0.88 0.01 0.01 0.01
A |   9  37   1   1   1  91
C |  43  44  10   1  97   1
G |  39  15   1  97   1   7
T |   8   3  88   1   1   1
A | -1.27  0.15 -3.47 -3.47 -3.47  1.05
C |  0.87  0.89 -0.59 -2.89  1.68 -2.89
G |  0.77 -0.18 -2.89  1.68 -2.89 -0.94
T | -1.39 -2.37  1.01 -3.47 -3.47 -3.47
PHD1_AFoat et. al.P = 1View matrix ↘
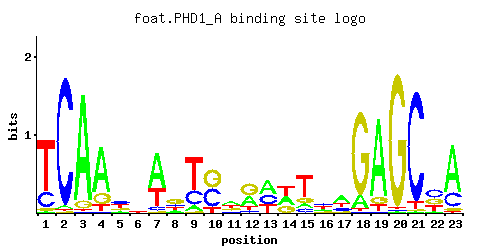
A | 0.02 0.24 0.06 0.01 0.07 0.02 0.23 0.28 0.62 0.36 0.26 0.13 0.27 0.12 0.62 0.17 0.31 0.33 0.33 0.10 0.01 0.01 0.71
C | 0.05 0.29 0.01 0.97 0.08 0.86 0.10 0.13 0.14 0.28 0.01 0.47 0.21 0.44 0.01 0.45 0.01 0.24 0.19 0.18 0.07 0.01 0.05
G | 0.22 0.42 0.93 0.01 0.01 0.01 0.21 0.33 0.11 0.02 0.30 0.06 0.13 0.44 0.27 0.20 0.07 0.20 0.36 0.01 0.01 0.96 0.22
T | 0.70 0.05 0.01 0.01 0.84 0.12 0.46 0.27 0.13 0.34 0.43 0.34 0.38 0.01 0.10 0.17 0.62 0.23 0.12 0.71 0.91 0.02 0.01
A |   2  24   6   1   7   2  23  28  62  36  26  13  27  12  62  17  31  33  33  10   1   1  71
C |   5  28   1  97   8  86  10  13  14  28   1  47  21  44   1  45   1  24  19  18   7   1   5
G |  22  42  93   1   1   1  21  33  11   2  30   6  13  44  27  20   7  20  36   1   1  96  22
T |  70   5   1   1  84  12  46  27  13  34  43  34  38   1  10  17  62  23  12  71  91   2   1
A | -2.77 -0.29 -1.67 -3.47 -1.52 -2.77 -0.33 -0.13  0.66  0.12 -0.21 -0.90 -0.17 -0.98  0.66 -0.63 -0.03  0.03  0.03 -1.16 -3.47 -3.47  0.80
C | -1.28  0.48 -2.89  1.68 -0.81  1.56 -0.59 -0.33 -0.25  0.44 -2.89  0.96  0.15  0.89 -2.89  0.92 -2.89  0.29  0.05  0.00 -0.94 -2.89 -1.28
G |  0.20  0.85  1.64 -2.89 -2.89 -2.89  0.15  0.61 -0.49 -2.20  0.51 -1.10 -0.33  0.89  0.41  0.11 -0.94  0.11  0.69 -2.89 -2.89  1.67  0.20
T |  0.78 -1.86 -3.47 -3.47  0.97 -0.98  0.36 -0.17 -0.90  0.06  0.30  0.06  0.17 -3.47 -1.16 -0.63  0.66 -0.33 -0.98  0.80  1.05 -2.77 -3.47
PHD1_BFoat et. al.P = 0.2826View matrix ↘
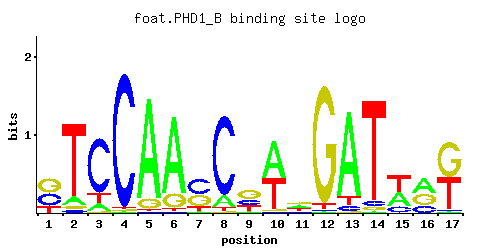
A | 0.46 0.01 0.45 0.90 0.08 0.04 0.28 0.45 0.25 0.03 0.14 0.02 0.01 0.01 0.13 0.84 0.19
C | 0.53 0.35 0.01 0.04 0.01 0.94 0.30 0.01 0.44 0.01 0.36 0.15 0.09 0.01 0.01 0.04 0.43
G | 0.01 0.20 0.17 0.05 0.05 0.01 0.11 0.01 0.26 0.85 0.47 0.01 0.01 0.97 0.76 0.04 0.37
T | 0.01 0.44 0.36 0.01 0.86 0.01 0.30 0.53 0.05 0.12 0.03 0.83 0.90 0.01 0.10 0.09 0.01
A |  46   1  45  90   8   4  28  45  25   3  14   2   1   1  13  84  19
C |  53  35   1   4   1  94  30   1  44   1  36  15   9   1   1   4  43
G |   1  20  17   5   5   1  11   1  26  85  47   1   1  97  76   4  37
T |   1  44  36   1  86   1  30  53   5  12   3  83  90   1  10   9   1
A |  0.36 -3.47  0.34  1.03 -1.39 -2.08 -0.13  0.34 -0.25 -2.37 -0.83 -2.77 -3.47 -3.47 -0.90  0.97 -0.52
C |  1.08  0.66 -2.89 -1.50 -2.89  1.65  0.51 -2.89  0.89 -2.89  0.69 -0.18 -0.69 -2.89 -2.89 -1.50  0.87
G | -2.89  0.11 -0.06 -1.28 -1.28 -2.89 -0.49 -2.89  0.37  1.55  0.96 -2.89 -2.89  1.68  1.44 -1.50  0.72
T | -3.47  0.32  0.12 -3.47  0.99 -3.47 -0.06  0.50 -1.86 -0.98 -2.37  0.95  1.03 -3.47 -1.16 -1.27 -3.47
PHD1_CFoat et. al.P = 1.20e-15View matrix ↘
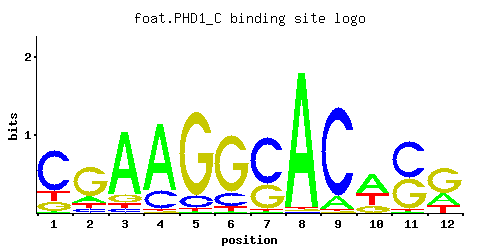
A | 0.01 0.13 0.81 0.77 0.01 0.01 0.01 0.97 0.12 0.51 0.01 0.25
C | 0.70 0.10 0.05 0.22 0.12 0.17 0.64 0.01 0.86 0.01 0.54 0.01
G | 0.15 0.67 0.10 0.01 0.86 0.76 0.34 0.01 0.01 0.19 0.45 0.58
T | 0.15 0.10 0.05 0.01 0.02 0.06 0.01 0.01 0.01 0.30 0.01 0.16
A |   1  13  81  77   1   1   1  97  12  51   1  25
C |  70  10   5  22  12  17  64   1  86   1  54   1
G |  15  67  10   1  86  76  34   1   1  19  45  57
T |  15  10   5   1   2   6   1   1   1  30   1  16
A | -3.47 -0.90  0.93  0.88 -3.47 -3.47 -3.47  1.11 -0.98  0.47 -3.47 -0.25
C |  1.36 -0.59 -1.28  0.20 -0.41 -0.06  1.27 -2.89  1.56 -2.89  1.10 -2.89
G | -0.18  1.31 -0.59 -2.89  1.56  1.44  0.64 -2.89 -2.89  0.05  0.92  1.17
T | -0.76 -1.16 -1.86 -3.47 -2.77 -1.67 -3.47 -3.47 -3.47 -0.06 -3.47 -0.69
PHD1Harbison et. al.P = 5.66e-20View matrix ↘
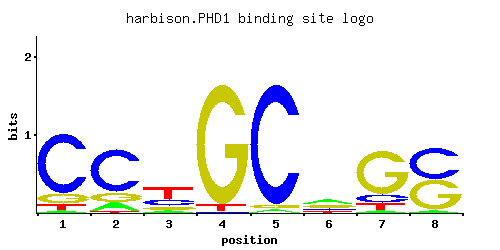
A | 0.004 0.108 0.150 0.003 0.044 0.502 0.010 0.060
C | 0.475 0.719 0.294 0.032 0.941 0.117 0.151 0.135
G | 0.489 0.142 0.154 0.943 0.011 0.269 0.699 0.782
T | 0.030 0.030 0.401 0.020 0.003 0.112 0.139 0.021
A |   0  10  15   0   4  50   1   6
C |  47  71  29   3  94  11  15  13
G |  48  14  15  94   1  26  69  78
T |   3   3  40   2   0  11  13   2
A | -4.38 -1.09 -0.76 -4.67 -1.98  0.45 -3.47 -1.67
C |  0.97  1.38  0.49 -1.73  1.65 -0.43 -0.18 -0.29
G |  1.00 -0.24 -0.16  1.66 -2.80  0.40  1.36  1.47
T | -2.37 -2.37  0.23 -2.77 -4.67 -1.05 -0.83 -2.72
PHD1Macisaac et. alP = 3.89e-18View matrix ↘
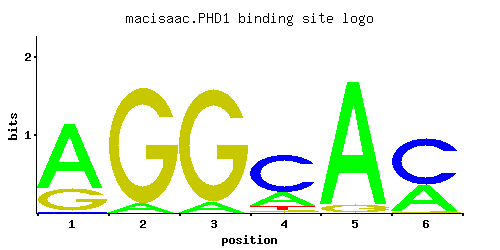
A | 0.734 0.074 0.082 0.227 0.939 0.339
C | 0.008 0.001 0.001 0.676 0.001 0.640
G | 0.257 0.924 0.916 0.037 0.059 0.019
T | 0.001 0.001 0.001 0.060 0.001 0.002
A |  73   7   8  22  93  33
C |   0   0   0  67   0  64
G |  25  92  91   3   5   1
T |   0   0   0   6   0   0
A |  0.83 -1.46 -1.36 -0.34  1.08  0.06
C | -3.11 -5.19 -5.19  1.32 -5.19  1.27
G |  0.36  1.64  1.63 -1.58 -1.12 -2.25
T | -5.77 -5.77 -5.77 -1.67 -5.77 -5.08
PHD1Zhu et. al.P = 0.0003297View matrix ↘
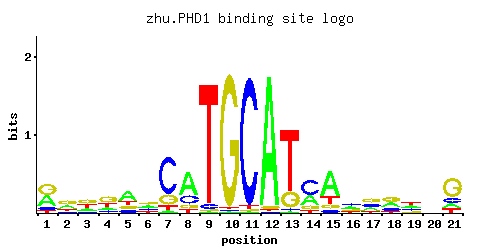
A | 0.40 0.31 0.17 0.16 0.51 0.30 0.04 0.61 0.01 0.01 0.01 0.96 0.01 0.30 0.62 0.32 0.24 0.29 0.33 0.27 0.13
C | 0.10 0.15 0.15 0.13 0.15 0.26 0.69 0.22 0.04 0.01 0.96 0.01 0.03 0.52 0.08 0.32 0.24 0.23 0.22 0.21 0.15
G | 0.42 0.39 0.42 0.45 0.17 0.33 0.19 0.10 0.01 0.97 0.01 0.02 0.20 0.12 0.10 0.21 0.41 0.40 0.12 0.30 0.61
T | 0.08 0.15 0.26 0.26 0.18 0.12 0.08 0.08 0.95 0.01 0.02 0.01 0.76 0.06 0.19 0.15 0.11 0.09 0.33 0.22 0.12
A |  40  31  17  16  51  30   4  61   1   1   1  96   1  30  62  32  24  28  33  27  13
C |  10  15  15  13  15  26  69  22   4   1  96   1   3  52   8  32  24  23  22  21  15
G |  42  39  42  45  17  33  19  10   1  97   1   2  20  12  10  21  41  40  12  30  61
T |   8  15  26  26  18  12   8   8  95   1   2   1  76   6  19  15  11   9  33  22  12
A |  0.22 -0.03 -0.63 -0.69  0.47 -0.06 -2.08  0.65 -3.47 -3.47 -3.47  1.10 -3.47 -0.06  0.66  0.00 -0.29 -0.10  0.03 -0.17 -0.90
C | -0.59 -0.18 -0.18 -0.33 -0.18  0.37  1.34  0.20 -1.50 -2.89  1.67 -2.89 -1.79  1.06 -0.81  0.58  0.29  0.25  0.20  0.15 -0.18
G |  0.85  0.77  0.85  0.92 -0.06  0.61  0.05 -0.59 -2.89  1.68 -2.89 -2.20  0.11 -0.41 -0.59  0.15  0.82  0.80 -0.41  0.51  1.22
T | -1.39 -0.76 -0.21 -0.21 -0.58 -0.98 -1.39 -1.39  1.09 -3.47 -2.77 -3.47  0.86 -1.67 -0.52 -0.76 -1.07 -1.27  0.03 -0.37 -0.98
PHD1Zhao and StormoP = 5.75e-21View matrix ↘
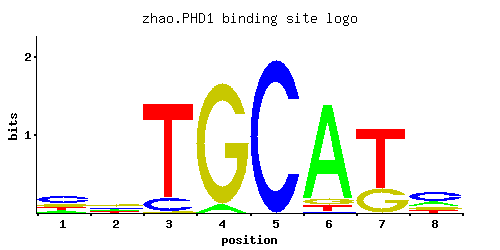
A | 0.146 0.231 0.002 0.060 0.001 0.886 0.001 0.224
C | 0.479 0.308 0.123 0.001 0.997 0.009 0.006 0.498
G | 0.207 0.318 0.010 0.937 0.001 0.059 0.291 0.174
T | 0.169 0.143 0.865 0.002 0.001 0.046 0.702 0.105
A |  14  23   0   6   0  88   0  22
C |  47  30  12   0  99   0   0  49
G |  20  31   1  93   0   5  29  17
T |  16  14  86   0   0   4  70  10
A | -0.78 -0.33 -5.08 -1.67 -5.77  1.02 -5.77 -0.36
C |  0.98  0.54 -0.38 -5.19  1.71 -3.00 -3.40  1.02
G |  0.14  0.57 -2.89  1.65 -5.19 -1.12  0.48 -0.03
T | -0.64 -0.81  0.99 -5.08 -5.77 -1.94  0.79 -1.11
Gene-level annotations and interactions.
Genes bound in ChIP-chip experiments 166 genes
YAL002W, YAL063C, YAL064W, YAR050W, YBL025W, YBL029W, YBL030C, YBL069W, YBL071C, YBR069C, YBR080C, YBR157C, YBR158W, YBR159W, YBR162C, YBR162W-A, YCL024W, YCL025C, YCL045C, YCR064C, YCR065W, YCR098C, YCR099C, YCR100C, YDL016C, YDL034W, YDL036C, YDL037C, YDL047W, YDL092W, YDL094C, YDL095W, YDL097C, YDL214C, YDL245C, YDR010C, YDR011W, YDR210W-D, YDR261C, YDR309C, YDR343C, YDR441C, YDR442W, YDR451C, YDR452W, YDR513W, YEL007W, YEL038W, YEL039C, YEL040W, YEL066W, YEL068C, YEL069C, YEL070W, YEL073C, YEL074W, YEL075C, YEL076C, YEL076C-A, YEL076W-C, YEL077C, YER033C, YER034W, YER045C, YER145C, YER146W, YFL026W, YFL027C, YFL062W, YGL156W, YGR140W, YGR200C, YGR249W, YGR251W, YGR279C, YHL024W, YHL028W, YHL029C, YHL039W, YHL040C, YHR005C, YHR136C, YHR137W, YHR170W, YHR213W, YIL010W, YIL012W, YIL013C, YIL099W, YIL118W, YIL120W, YIL132C, YIL170W, YIL171W, YIL172C, YIL173W, YIL174W, YIL175W, YIR020C, YJL076W, YJL077C, YJL079C, YJL105W, YJL138C, YJL217W, YJL218W, YJL219W, YJL221C, YJR094C, YJR095W, YJR127C, YJR158W, YJR159W, YKL058W, YKL059C, YKL062W, YKL063C, YKL108W, YKL109W, YKL110C, YKR102W, YLL028W, YLL063C, YLR004C, YLR005W, YLR044C, YLR046C, YML115C, YML116W, YML131W, YMR004W, YMR011W, YMR015C, YMR016C, YMR017W, YMR018W, YMR019W, YMR020W, YMR135C, YMR136W, YMR137C, YMR138W, YMR195W, YMR265C, YMR266W, YNL145W, YNL178W, YNL332W, YNL335W, YOL154W, YOR107W, YOR161C, YOR179C, YOR355W, YPL024W, YPL025C, YPL081W, YPL082C, YPL177C, YPL230W, YPL265W, YPL283C, YPR013C, YPR065W, YPR202W, YPR203W
Genes affected by TF deletion 110 genes
YCR040W, YIL082W-A, YML112W, YOL047C, YGL009C, YKL043W, YGR279C, YHL047C, YIL082W, YJR053W, YKR038C, YKR042W, YKR013W, YLR279W, YMR044W, YOR226C, YDR193W, YDR221W, YFR035C, YHR143W-A, YHR116W, YOR382W, YER011W, YCR079W, YFR005C, YIR034C, YJR116W, YOR351C, YPL187W, YER026C, YHR208W, YML085C, YBR067C, YDR461W, YNL146W, YOL073C, YPR013C, YPR015C, YCL018W, YER083C, YIL015W, YML055W, YNL300W, YPL219W, YMR230W, YMR202W, YNL279W, YER154W, YJR148W, YAL012W, YAL014C, YER001W, YKL118W, YFL018C, YLR348C, YMR139W, YOL144W, YOL086C, YPL195W, YKL209C, YKL178C, YPL120W, YLR343W, YLR349W, YMR081C, YOL111C, YOL143C, YOR221C, YBL032W, YJL158C, YKL177W, YNR032W, YKR093W, YOR239W, YLR040C, YLR042C, YLR420W, YCL066W, YKR086W, YML126C, YAL022C, YKL120W, YLR041W, YOR084W, YCR097W, YFL026W, YOL126C, YOR383C, YGL089C, YOR366W, YJR004C, YKL216W, YNR044W, YNL322C, YPL163C, YLR303W, YOR247W, YEL038W, YPL011C, YLR302C, YOR246C, YOR248W, YAR031W, YGL032C, YDR104C, YOR034C, YER078C, YGR274C, YDR360W, YER073W
Genes supported by both experiments 4 genes
YEL038W, YFL026W, YGR279C, YPR013C
Predicted TF–TF partners 10 genes
DAL82, GIS1, GSM1, MSN2, MSN4, RDS1, SKN7, SUT1, USV1, YER184C