PDR3
YBL005W, TPE2, AMY2
Transcriptional activator of the pleiotropic drug resistance network, regulates expression of ATP-binding cassette (ABC) transporters through binding to cis-acting sites known as PDREs (PDR responsive elements)
Best-performing DNA-binding model.
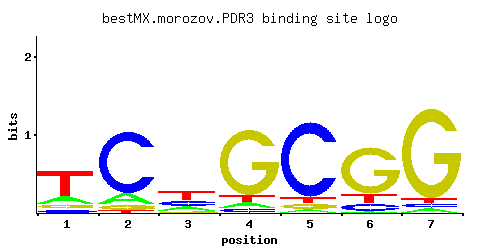
View and copy the recommended matrices ↘
A | 0.187 0.126 0.196 0.060 0.034 0.024 0.036
C | 0.087 0.791 0.280 0.053 0.842 0.118 0.040
G | 0.098 0.060 0.072 0.818 0.062 0.733 0.884
T | 0.628 0.023 0.451 0.069 0.062 0.126 0.040
A |  18  12  19   6   3   2   3
C |   8  79  28   5  84  11   4
G |   9   6   7  81   6  73  88
T |  62   2  45   6   6  12   4
A | -0.54 -0.93 -0.49 -1.67 -2.24 -2.59 -2.18
C | -0.73  1.48  0.44 -1.22  1.54 -0.42 -1.50
G | -0.61 -1.10 -0.92  1.51 -1.07  1.40  1.59
T |  0.67 -2.63  0.34 -1.53 -1.64 -0.93 -2.08
Alternative candidate matrices 8
Historical matrix candidates from the original ScerTF database. Expand a source to inspect its original logo, scores, and matrix values.
PDR3Foat et. al.P = 1View matrix ↘
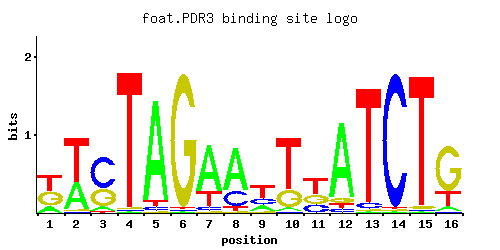
A | 0.16 0.37 0.08 0.01 0.90 0.01 0.70 0.67 0.19 0.04 0.01 0.85 0.01 0.01 0.01 0.07
C | 0.01 0.01 0.59 0.01 0.04 0.01 0.07 0.25 0.26 0.01 0.24 0.05 0.05 0.97 0.01 0.01
G | 0.40 0.01 0.32 0.01 0.01 0.97 0.01 0.01 0.05 0.24 0.29 0.06 0.01 0.01 0.02 0.70
T | 0.42 0.62 0.01 0.97 0.05 0.01 0.22 0.07 0.49 0.72 0.46 0.05 0.93 0.01 0.96 0.22
A |  16  37   8   1  90   1  70  67  19   4   1  85   1   1   1   7
C |   1   1  59   1   4   1   7  25  26   1  24   5   5  97   1   1
G |  40   1  32   1   1  97   1   1   5  24  28   6   1   1   2  70
T |  42  62   1  97   5   1  22   7  49  72  46   5  93   1  96  22
A | -0.69  0.15 -1.39 -3.47  1.03 -3.47  0.78  0.74 -0.52 -2.08 -3.47  0.98 -3.47 -3.47 -3.47 -1.52
C | -2.89 -2.89  1.19 -2.89 -1.50 -2.89 -0.94  0.33  0.37 -2.89  0.29 -1.28 -1.28  1.68 -2.89 -2.89
G |  0.80 -2.89  0.58 -2.89 -2.89  1.68 -2.89 -2.89 -1.28  0.29  0.48 -1.10 -2.89 -2.89 -2.20  1.36
T |  0.27  0.66 -3.47  1.11 -1.86 -3.47 -0.37 -1.52  0.43  0.81  0.36 -1.86  1.07 -3.47  1.10 -0.37
PDR3_AFordyce et. al.P = 0.5735View matrix ↘
PDR3_BFordyce et. al.P = 0.1947View matrix ↘
PDR3_CFordyce et. al.P = 0.5358View matrix ↘
PDR3Harbison et. al.P = 0.08976View matrix ↘
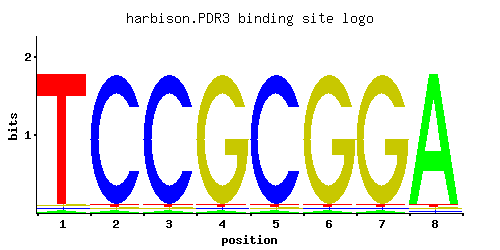
A | 0.012 0.012 0.012 0.012 0.012 0.012 0.012 0.965
C | 0.012 0.964 0.964 0.012 0.964 0.012 0.012 0.012
G | 0.012 0.012 0.012 0.964 0.012 0.964 0.964 0.012
T | 0.965 0.012 0.012 0.012 0.012 0.012 0.012 0.012
A |   1   1   1   1   1   1   1  96
C |   1  96  96   1  96   1   1   1
G |   1   1   1  96   1  96  96   1
T |  96   1   1   1   1   1   1   1
A | -3.28 -3.28 -3.28 -3.28 -3.28 -3.28 -3.28  1.10
C | -2.71  1.68  1.68 -2.71  1.68 -2.71 -2.71 -2.71
G | -2.71 -2.71 -2.71  1.68 -2.71  1.68  1.68 -2.71
T |  1.10 -3.28 -3.28 -3.28 -3.28 -3.28 -3.28 -3.28
PDR3Macisaac et. alP = 0.08976View matrix ↘
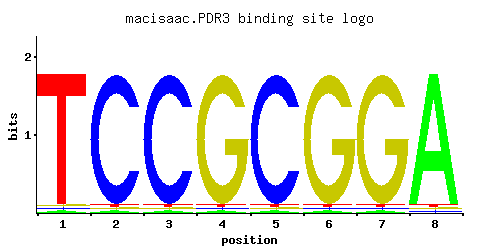
A | 0.012 0.012 0.012 0.012 0.012 0.012 0.012 0.964
C | 0.012 0.964 0.964 0.012 0.964 0.012 0.012 0.012
G | 0.012 0.012 0.012 0.964 0.012 0.964 0.964 0.012
T | 0.964 0.012 0.012 0.012 0.012 0.012 0.012 0.012
A |   1   1   1   1   1   1   1  96
C |   1  96  96   1  96   1   1   1
G |   1   1   1  96   1  96  96   1
T |  96   1   1   1   1   1   1   1
A | -3.28 -3.28 -3.28 -3.28 -3.28 -3.28 -3.28  1.10
C | -2.71  1.68  1.68 -2.71  1.68 -2.71 -2.71 -2.71
G | -2.71 -2.71 -2.71  1.68 -2.71  1.68  1.68 -2.71
T |  1.10 -3.28 -3.28 -3.28 -3.28 -3.28 -3.28 -3.28
PDR3Pachkov et alP = 0.03168View matrix ↘
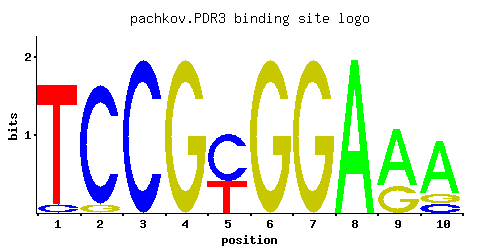
A | 0.001 0.001 0.001 0.001 0.001 0.400 0.001 0.001 0.001 0.933
C | 0.133 0.333 0.001 1.000 1.000 0.001 1.000 0.001 0.067 0.001
G | 0.133 0.001 0.001 0.001 0.001 0.600 0.001 1.000 0.933 0.067
T | 0.733 0.667 1.000 0.001 0.001 0.001 0.001 0.001 0.001 0.001
A |   0   0   0   0   0  40   0   0   0  93
C |  13  33   0 100 100   0 100   0   6   0
G |  13   0   0   0   0  60   0 100  93   6
T |  73  66 100   0   0   0   0   0   0   0
A | -5.77 -5.77 -5.77 -5.77 -5.77  0.22 -5.77 -5.77 -5.77  1.07
C | -0.30  0.62 -5.19  1.71  1.71 -5.19  1.71 -5.19 -0.99 -5.19
G | -0.30 -5.19 -5.19 -5.19 -5.19  1.20 -5.19  1.71  1.65 -0.99
T |  0.83  0.73  1.14 -5.77 -5.77 -5.77 -5.77 -5.77 -5.77 -5.77
PDR3Zhu J and MQ ZhangP = 0.08976View matrix ↘
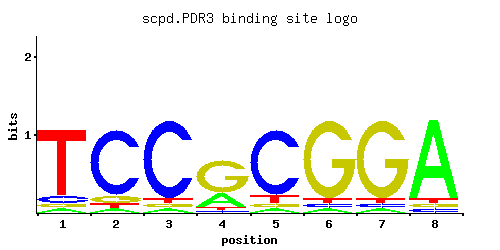
A | 0.05 0.05 0.05 0.09 0.05 0.05 0.05 0.82
C | 0.05 0.86 0.86 0.05 0.64 0.05 0.09 0.05
G | 0.05 0.05 0.05 0.82 0.05 0.86 0.82 0.09
T | 0.86 0.05 0.05 0.05 0.27 0.05 0.05 0.05
A |   5   5   5   9   5   5   5  82
C |   5  86  86   5  64   5   9   5
G |   5   5   5  82   5  86  82   9
T |  86   5   5   5  27   5   5   5
A | -1.86 -1.86 -1.86 -1.27 -1.86 -1.86 -1.86  0.94
C | -1.28  1.56  1.56 -1.28  1.27 -1.28 -0.69 -1.28
G | -1.28 -1.28 -1.28  1.52 -1.28  1.56  1.52 -0.69
T |  0.99 -1.86 -1.86 -1.86 -0.17 -1.86 -1.86 -1.86
Gene-level annotations and interactions.
Genes bound in ChIP-chip experiments 72 genes
YAR050W, YBL005W, YBL006C, YBL059W, YBR080C, YBR127C, YBR214W, YCR020C-A, YCR032W, YDL027C, YDL091C, YDR048C, YDR091C, YDR092W, YDR142C, YDR289C, YDR319C, YDR415C, YDR416W, YDR446W, YDR468C, YDR469W, YGL004C, YGL059W, YGL066W, YGL113W, YGR110W, YGR166W, YGR218W, YHR064C, YIL068C, YJL095W, YJR007W, YJR054W, YJR069C, YJR071W, YJR096W, YJR132W, YKL077W, YKL169C, YKR105C, YKR106W, YLR239C, YLR240W, YLR343W, YLR456W, YML093W, YML095C-A, YML096W, YML097C, YMR094W, YMR126C, YMR193W, YMR257C, YMR258C, YMR290W-A, YNL168C, YNL258C, YNR007C, YNR008W, YOL003C, YOL083W, YOR148C, YOR205C, YOR206W, YOR233W, YOR280C, YOR282W, YOR287C, YOR322C, YOR339C, YPR087W
Genes affected by TF deletion 79 genes
YJR054W, YML117W-A, YDL100C, YGL039W, YGL009C, YJL053W, YLR090W, YMR220W, YPL053C, YDR207C, YNL051W, YMR198W, YHR145C, YPL016W, YDR130C, YGL262W, YMR134W, YOL104C, YNR065C, YGL075C, YDR099W, YLR341W, YOR320C, YMR020W, YOR075W, YGL239C, YGL180W, YOR230W, YJR148W, YEL051W, YGL048C, YGR161C-D, YLR035C-A, YLR099C, YLR101C, YOR074C, YOR046C, YPL054W, YCR086W, YHR093W, YJR155W, YLL038C, YLR348C, YMR145C, YNR002C, YLR345W, YLR349W, YCL025C, YJL156C, YMR321C, YBR018C, YDR414C, YJR100C, YJR038C, YOL031C, YOR209C, YPL191C, YGL027C, YBR049C, YBR051W, YCL066W, YGL188C, YIL097W, YIL099W, YNL100W, YKL120W, YBR146W, YDR110W, YDR484W, YKL001C, YNL191W, YBL006C, YER100W, YJR006W, YJR107W, YHR135C, YEL010W, YLL025W, YCL006C
Genes supported by both experiments 2 genes
YBL006C, YJR054W
Predicted TF–TF partners 7 genes
CIN5, GSM1, MIG1, PDR8, RGT1, SUT1, YER184C