OPI1
YHL020C
Transcriptional regulator of a variety of genes; phosphorylation by protein kinase A stimulates Opi1p function in negative regulation of phospholipid biosynthetic genes; involved in telomere maintenance
Best-performing DNA-binding model.
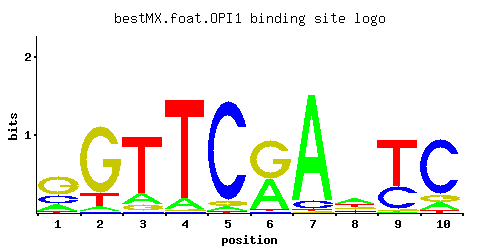
View and copy the recommended matrices ↘
A | 0.19 0.05 0.14 0.09 0.04 0.43 0.91 0.44 0.01 0.10
C | 0.24 0.01 0.01 0.01 0.90 0.01 0.07 0.16 0.32 0.77
G | 0.55 0.81 0.09 0.01 0.05 0.56 0.01 0.17 0.02 0.10
T | 0.03 0.14 0.77 0.89 0.01 0.01 0.01 0.23 0.66 0.03
A |  19   5  14   9   4  43  91  44   1  10
C |  24   1   1   1  90   1   7  16  32  77
G |  55  81   9   1   5  56   1  17   2  10
T |   3  14  77  89   1   1   1  23  66   3
A | -0.52 -1.86 -0.83 -1.27 -2.08  0.30  1.05  0.32 -3.47 -1.16
C |  0.29 -2.89 -2.89 -2.89  1.61 -2.89 -0.94 -0.12  0.58  1.45
G |  1.12  1.50 -0.69 -2.89 -1.28  1.13 -2.89 -0.06 -2.20 -0.59
T | -2.37 -0.83  0.88  1.02 -3.47 -3.47 -3.47 -0.33  0.72 -2.37
Alternative candidate matrices 2
Historical matrix candidates from the original ScerTF database. Expand a source to inspect its original logo, scores, and matrix values.
OPI1Harbison et. al.P = 0.7927View matrix ↘
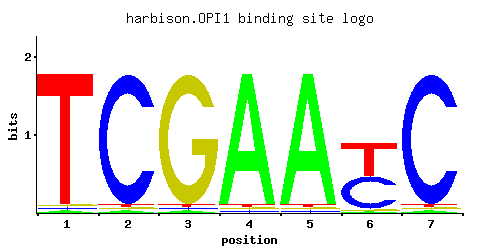
A | 0.012 0.012 0.012 0.965 0.965 0.012 0.012
C | 0.012 0.965 0.012 0.012 0.012 0.488 0.965
G | 0.012 0.012 0.965 0.012 0.012 0.012 0.012
T | 0.965 0.012 0.012 0.012 0.012 0.488 0.012
A |   1   1   1  96  96   1   1
C |   1  96   1   1   1  48  96
G |   1   1  96   1   1   1   1
T |  96   1   1   1   1  48   1
A | -3.28 -3.28 -3.28  1.10  1.10 -3.28 -3.28
C | -2.71  1.68 -2.71 -2.71 -2.71  1.00  1.68
G | -2.71 -2.71  1.68 -2.71 -2.71 -2.71 -2.71
T |  1.10 -3.28 -3.28 -3.28 -3.28  0.42 -3.28
OPI1Macisaac et. alP = 0.3819View matrix ↘
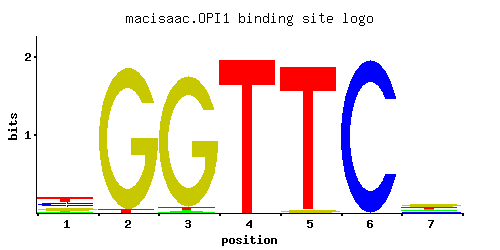
A | 0.218 0.001 0.980 0.997 0.018 0.018 0.364
C | 0.400 0.001 0.018 0.001 0.963 0.980 0.218
G | 0.164 0.997 0.001 0.001 0.001 0.001 0.327
T | 0.218 0.001 0.001 0.001 0.018 0.001 0.091
A |  21   0  98  99   1   1  36
C |  40   0   1   0  96  98  21
G |  16  99   0   0   0   0  32
T |  21   0   0   0   1   0   9
A | -0.38 -5.77  1.12  1.14 -2.88 -2.88  0.13
C |  0.80 -5.19 -2.30 -5.19  1.68  1.69  0.19
G | -0.09  1.71 -5.19 -5.19 -5.19 -5.19  0.60
T | -0.38 -5.77 -5.77 -5.77 -2.88 -5.77 -1.26
Gene-level annotations and interactions.
Genes bound in ChIP-chip experiments 29 genes
YAR009C, YAR050W, YBR029C, YBR030W, YDR146C, YDR147W, YDR194C, YDR195W, YDR497C, YFR029W, YFR036W, YGR256W, YHR005C-A, YIL102C, YJL148W, YJL152W, YJL153C, YJL191W, YJL192C, YJR100C, YKL182W, YLL004W, YLL005C, YLR011W, YNL129W, YNL130C, YOR236W, YPL198W, YPL231W
Genes affected by TF deletion 133 genes
YGL230C, YNL052W, YJL115W, YKL043W, YOR065W, YPL019C, YPL053C, YBR029C, YIL143C, YDL127W, YFR033C, YGR151C, YGR157W, YJL048C, YLR460C, YPL016W, YPL052W, YPR140W, YHR053C, YHR055C, YOL108C, YER026C, YGL077C, YML027W, YOR097C, YOR129C, YBR129C, YDR497C, YGR004W, YLL061W, YOL107W, YDR275W, YJL210W, YKL142W, YIL124W, YNL089C, YOR229W, YHR123W, YMR173W, YHR004C, YLR253W, YNL090W, YOR230W, YOR264W, YGR131W, YLR099C, YMR199W, YOR074C, YPL026C, YDR502C, YIR042C, YLR005W, YLR380W, YNR016C, YJL153C, YJL185C, YKL182W, YLR132C, YNR035C, YPL156C, YGR040W, YMR144W, YOR298C-A, YOR328W, YLR191W, YLR133W, YMR030W, YNL065W, YOL002C, YBR177C, YGL055W, YNL257C, YNL289W, YKR056W, YNL098C, YOL032W, YPL188W, YMR173W-A, YNL256W, YPL061W, YHR067W, YKL001C, YLR352W, YNL191W, YOL154W, YER043C, YGR260W, YGR234W, YIL034C, YJL167W, YLR136C, YLR168C, YLR172C, YMR300C, YMR272C, YDR481C, YKL027W, YJR133W, YER044C, YGR259C, YJL196C, YER091C, YHR018C, YJR104C, YNL044W, YPL231W, YDR274C, YGR176W, YHR200W, YJL079C, YJR073C, YLR241W, YMR038C, YNL043C, YBR178W, YBR244W, YGR149W, YGR177C, YJL142C, YLR049C, YPL042C, YDR124W, YFR030W, YNL141W, YKR004C, YDR123C, YNL170W, YOL101C, YOL103W, YOR306C, YPR069C, YLR173W, YNR019W
Genes supported by both experiments 5 genes
YBR029C, YDR497C, YJL153C, YKL182W, YPL231W
Predicted TF–TF partners 1 genes
STP3