← All factors / TF RECORD
MOT2
YER068W, SIG1, NOT4
Subunit of the CCR4-NOT complex, which has roles in transcription regulation, mRNA degradation, and post-transcriptional modifications; with Ubc4p, ubiquitinates nascent polypeptide-associated complex subunits and histone demethyase Jhd2p
01 / RECOMMENDED MATRIX
Best-performing DNA-binding model.
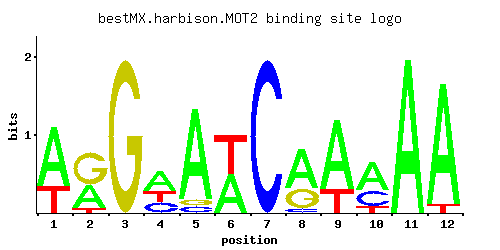
Fisher’s P-value5.15e-16
Information content13.47
Max PWM score11.5
Recommended cutoff8.05
View and copy the recommended matrices ↘
Position frequency matrix (PFM)
A | 0.687 0.375 0.001 0.500 0.875 0.500 0.001 0.625 0.750 0.562 0.999 0.937
C | 0.001 0.001 0.001 0.250 0.063 0.001 1.000 0.063 0.001 0.312 0.001 0.001
G | 0.001 0.562 1.000 0.001 0.063 0.001 0.001 0.312 0.001 0.001 0.001 0.001
T | 0.313 0.063 0.001 0.250 0.001 0.500 0.001 0.001 0.250 0.125 0.001 0.063
Position count matrix (PCM)
A |  68  37   0  50  87  50   0  62  75  56  99  93
C |   0   0   0  25   6   0 100   6   0  31   0   0
G |   0  56 100   0   6   0   0  31   0   0   0   0
T |  31   6   0  25   0  50   0   0  25  12   0   6
Position weight matrix (PWM)
A |  0.76  0.16 -5.77  0.45  1.01  0.45 -5.77  0.67  0.85  0.56  1.14  1.07
C | -5.19 -5.19 -5.19  0.33 -1.05 -5.19  1.71 -1.05 -5.19  0.55 -5.19 -5.19
G | -5.19  1.14  1.71 -5.19 -1.05 -5.19 -5.19  0.55 -5.19 -5.19 -5.19 -5.19
T | -0.02 -1.63 -5.77 -0.25 -5.77  0.45 -5.77 -5.77 -0.25 -0.94 -5.77 -1.63
02 / COMPARATIVE BENCHMARKS
Alternative candidate matrices 3
Historical matrix candidates from the original ScerTF database. Expand a source to inspect its original logo, scores, and matrix values.
MOT2Badis et. al.P = 0.5577View matrix ↘
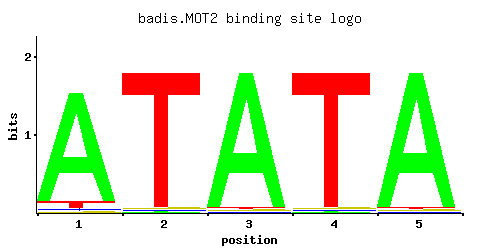
Fisher’s P-value0.5577
Information content6.837
Max PWM score5.5
Recommended cutoff5.5
Position frequency matrix (PFM)
A | 0.92 0.01 0.97 0.01 0.97
C | 0.02 0.01 0.01 0.01 0.01
G | 0.01 0.01 0.01 0.01 0.01
T | 0.05 0.97 0.01 0.97 0.01
Position count matrix (PCM)
A |  92   1  97   1  97
C |   2   1   1   1   1
G |   1   1   1   1   1
T |   5  97   1  97   1
Position weight matrix (PWM)
A |  1.06 -3.47  1.11 -3.47  1.11
C | -2.20 -2.89 -2.89 -2.89 -2.89
G | -2.89 -2.89 -2.89 -2.89 -2.89
T | -1.86  1.11 -3.47  1.11 -3.47
MOT2_AFoat et. al.P = 1View matrix ↘
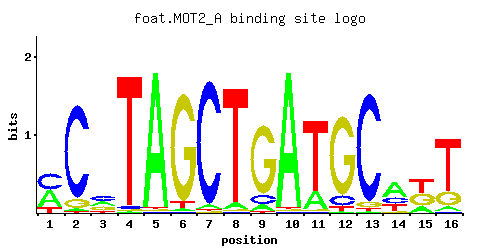
Fisher’s P-value1
Information content19.16
Max PWM score18.44
Recommended cutoff13.83
Position frequency matrix (PFM)
A | 0.41 0.02 0.30 0.01 0.97 0.02 0.03 0.05 0.07 0.97 0.20 0.01 0.01 0.52 0.20 0.06
C | 0.43 0.88 0.36 0.02 0.01 0.01 0.95 0.01 0.11 0.01 0.01 0.11 0.92 0.22 0.01 0.01
G | 0.01 0.09 0.27 0.01 0.01 0.91 0.01 0.01 0.82 0.01 0.01 0.84 0.05 0.05 0.37 0.20
T | 0.14 0.01 0.07 0.96 0.01 0.05 0.01 0.93 0.01 0.01 0.79 0.04 0.02 0.21 0.42 0.73
Position count matrix (PCM)
A |  41   2  30   1  97   2   3   5   7  97  20   1   1  52  20   6
C |  43  88  36   2   1   1  95   1  11   1   1  11  92  22   1   1
G |   1   9  27   1   1  91   1   1  82   1   1  84   5   5  37  20
T |  14   1   7  96   1   5   1  93   1   1  79   4   2  21  42  73
Position weight matrix (PWM)
A |  0.25 -2.77 -0.06 -3.47  1.11 -2.77 -2.37 -1.86 -1.52  1.11 -0.47 -3.47 -3.47  0.49 -0.47 -1.67
C |  0.87  1.59  0.69 -2.20 -2.89 -2.89  1.66 -2.89 -0.49 -2.89 -2.89 -0.49  1.63  0.20 -2.89 -2.89
G | -2.89 -0.69  0.41 -2.89 -2.89  1.62 -2.89 -2.89  1.52 -2.89 -2.89  1.54 -1.28 -1.28  0.72  0.11
T | -0.83 -3.47 -1.52  1.10 -3.47 -1.86 -3.47  1.07 -3.47 -3.47  0.90 -2.08 -2.77 -0.42  0.27  0.82
MOT2_BFoat et. al.P = 1View matrix ↘
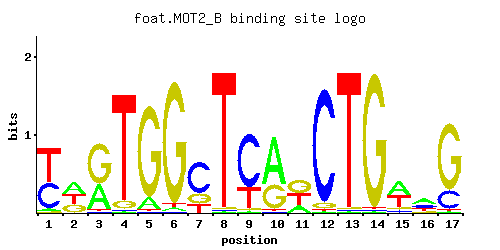
Fisher’s P-value1
Information content19.39
Max PWM score18.71
Recommended cutoff14.03
Position frequency matrix (PFM)
A | 0.01 0.21 0.39 0.01 0.97 0.01 0.35 0.01 0.26 0.97 0.16 0.02 0.01 0.91 0.02 0.32 0.54
C | 0.77 0.11 0.08 0.97 0.01 0.05 0.42 0.34 0.02 0.01 0.20 0.96 0.87 0.07 0.60 0.29 0.01
G | 0.21 0.26 0.08 0.01 0.01 0.93 0.01 0.01 0.71 0.01 0.64 0.01 0.01 0.01 0.01 0.01 0.42
T | 0.01 0.42 0.45 0.01 0.01 0.01 0.22 0.64 0.01 0.01 0.01 0.02 0.11 0.01 0.37 0.39 0.03
Position count matrix (PCM)
A |   1  21  39   1  97   1  35   1  26  97  16   2   1  91   2  32  54
C |  77  11   8  97   1   5  42  34   2   1  20  96  87   7  60  28   1
G |  21  26   8   1   1  93   1   1  71   1  64   1   1   1   1   1  42
T |   1  42  45   1   1   1  22  64   1   1   1   2  11   1  37  39   3
Position weight matrix (PWM)
A | -3.47 -0.42  0.20 -3.47  1.11 -3.47  0.09 -3.47 -0.21  1.11 -0.69 -2.77 -3.47  1.05 -2.77  0.00  0.52
C |  1.45 -0.49 -0.81  1.68 -2.89 -1.28  0.85  0.64 -2.20 -2.89  0.11  1.67  1.58 -0.94  1.20  0.48 -2.89
G |  0.15  0.37 -0.81 -2.89 -2.89  1.64 -2.89 -2.89  1.37 -2.89  1.27 -2.89 -2.89 -2.89 -2.89 -2.89  0.85
T | -3.47  0.27  0.34 -3.47 -3.47 -3.47 -0.37  0.69 -3.47 -3.47 -3.47 -2.77 -1.07 -3.47  0.15  0.20 -2.37
03 / EXPERIMENTAL CONTEXT
Gene-level annotations and interactions.
Genes bound in ChIP-chip experiments 1 genes
No Data
Genes affected by TF deletion 32 genes
YFR033C, YPL016W, YIL015C-A, YBR129C, YFR006W, YGR247W, YPL083C, YCL065W, YGL207W, YLR224W, YOR043W, YJR094C, YMR023C, YJR148W, YLR099C, YBL031W, YKL213C, YMR110C, YKR024C, YNL065W, YPL221W, YNL289W, YHR072W, YKL031W, YBR054W, YLR297W, YKL161C, YEL003W, YLR016C, YNL202W, YOL101C, YJL202C
Predicted TF–TF partners 1 genes
XBP1