MIG2
YGL209W, MLZ1
Protein containing zinc fingers, involved in repression, along with Mig1p, of SUC2 (invertase) expression by high levels of glucose; binds to Mig1p-binding sites in SUC2 promoter
Best-performing DNA-binding model.
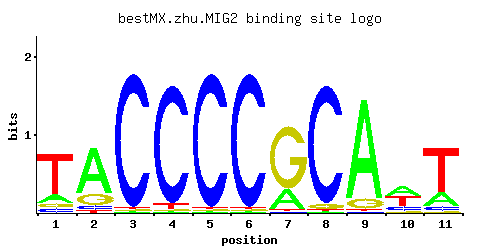
View and copy the recommended matrices ↘
A | 0.15 0.72 0.01 0.01 0.01 0.01 0.23 0.01 0.89 0.40 0.21
C | 0.07 0.06 0.97 0.94 0.97 0.97 0.01 0.94 0.01 0.16 0.07
G | 0.07 0.18 0.01 0.01 0.01 0.01 0.75 0.04 0.09 0.05 0.02
T | 0.71 0.04 0.01 0.04 0.01 0.01 0.01 0.01 0.01 0.39 0.70
A |  15  72   1   1   1   1  23   1  89  40  21
C |   7   6  97  94  97  97   1  94   1  16   7
G |   7  18   1   1   1   1  75   4   9   5   2
T |  71   4   1   4   1   1   1   1   1  39  70
A | -0.76  0.81 -3.47 -3.47 -3.47 -3.47 -0.33 -3.47  1.02  0.22 -0.42
C | -0.94 -1.10  1.68  1.65  1.68  1.68 -2.89  1.65 -2.89 -0.12 -0.94
G | -0.94  0.00 -2.89 -2.89 -2.89 -2.89  1.43 -1.50 -0.69 -1.28 -2.20
T |  0.80 -2.08 -3.47 -2.08 -3.47 -3.47 -3.47 -3.47 -3.47  0.20  0.78
Alternative candidate matrices 4
Historical matrix candidates from the original ScerTF database. Expand a source to inspect its original logo, scores, and matrix values.
MIG2Badis et. al.P = 0.07194View matrix ↘
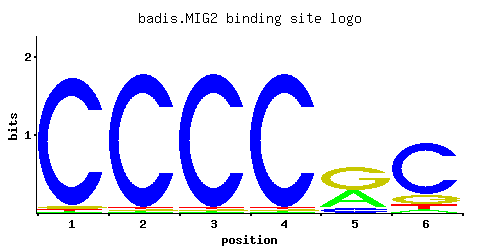
A | 0.01 0.01 0.01 0.01 0.36 0.05
C | 0.96 0.97 0.97 0.97 0.11 0.76
G | 0.02 0.01 0.01 0.01 0.52 0.13
T | 0.01 0.01 0.01 0.01 0.01 0.06
A |   1   1   1   1  36   5
C |  96  97  97  97  11  76
G |   2   1   1   1  52  13
T |   1   1   1   1   1   6
A | -3.47 -3.47 -3.47 -3.47  0.12 -1.86
C |  1.67  1.68  1.68  1.68 -0.49  1.44
G | -2.20 -2.89 -2.89 -2.89  1.06 -0.33
T | -3.47 -3.47 -3.47 -3.47 -3.47 -1.67
MIG2_AFoat et. al.P = 0.01204View matrix ↘
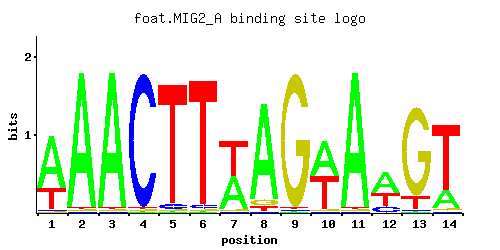
A | 0.77 0.12 0.31 0.01 0.48 0.01 0.04 0.51 0.95 0.94 0.01 0.01 0.01 0.27
C | 0.02 0.86 0.01 0.01 0.01 0.97 0.06 0.01 0.01 0.01 0.01 0.01 0.01 0.01
G | 0.01 0.01 0.16 0.01 0.01 0.01 0.01 0.01 0.03 0.04 0.97 0.01 0.01 0.02
T | 0.20 0.01 0.52 0.97 0.51 0.01 0.90 0.48 0.01 0.01 0.01 0.97 0.97 0.69
A |  77  12  31   1  48   1   4  51  95  94   1   1   1  27
C |   2  86   1   1   1  97   6   1   1   1   1   1   1   1
G |   1   1  16   1   1   1   1   1   3   4  97   1   1   2
T |  20   1  52  97  51   1  90  48   1   1   1  97  97  69
A |  0.88 -0.98 -0.03 -3.47  0.41 -3.47 -2.08  0.47  1.09  1.08 -3.47 -3.47 -3.47 -0.17
C | -2.20  1.56 -2.89 -2.89 -2.89  1.68 -1.10 -2.89 -2.89 -2.89 -2.89 -2.89 -2.89 -2.89
G | -2.89 -2.89 -0.12 -2.89 -2.89 -2.89 -2.89 -2.89 -1.79 -1.50  1.68 -2.89 -2.89 -2.20
T | -0.47 -3.47  0.49  1.11  0.47 -3.47  1.03  0.41 -3.47 -3.47 -3.47  1.11  1.11  0.77
MIG2_BFoat et. al.P = 0.005217View matrix ↘
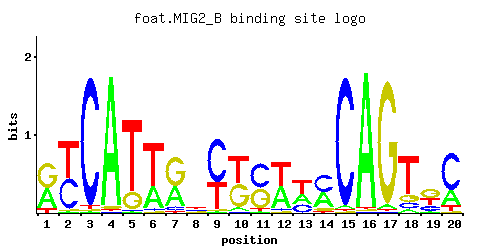
A | 0.39 0.01 0.01 0.96 0.01 0.32 0.36 0.17 0.01 0.06 0.03 0.44 0.31 0.39 0.02 0.97 0.03 0.05 0.05 0.25
C | 0.01 0.45 0.96 0.01 0.01 0.03 0.07 0.28 0.61 0.01 0.51 0.05 0.25 0.47 0.96 0.01 0.01 0.11 0.23 0.66
G | 0.52 0.01 0.01 0.02 0.19 0.01 0.56 0.24 0.01 0.44 0.41 0.03 0.01 0.09 0.01 0.01 0.95 0.14 0.43 0.01
T | 0.08 0.54 0.02 0.01 0.79 0.64 0.01 0.31 0.37 0.50 0.05 0.48 0.44 0.04 0.01 0.01 0.01 0.71 0.29 0.09
A |  39   1   1  96   1  32  36  17   1   6   3  44  31  39   2  97   3   5   5  25
C |   1  45  96   1   1   3   7  28  61   1  51   5  25  47  96   1   1  11  23  66
G |  52   1   1   2  19   1  56  24   1  44  41   3   1   9   1   1  95  14  43   1
T |   8  54   2   1  79  64   1  31  37  50   5  48  44   4   1   1   1  71  28   9
A |  0.20 -3.47 -3.47  1.10 -3.47  0.00  0.12 -0.63 -3.47 -1.67 -2.37  0.32 -0.03  0.20 -2.77  1.11 -2.37 -1.86 -1.86 -0.25
C | -2.89  0.92  1.67 -2.89 -2.89 -1.79 -0.94  0.44  1.22 -2.89  1.04 -1.28  0.33  0.96  1.67 -2.89 -2.89 -0.49  0.25  1.30
G |  1.06 -2.89 -2.89 -2.20  0.05 -2.89  1.13  0.29 -2.89  0.89  0.82 -1.79 -2.89 -0.69 -2.89 -2.89  1.66 -0.25  0.87 -2.89
T | -1.39  0.52 -2.77 -3.47  0.90  0.69 -3.47 -0.03  0.15  0.45 -1.86  0.41  0.32 -2.08 -3.47 -3.47 -3.47  0.80 -0.10 -1.27
MIG2Zhao and StormoP = 0.07194View matrix ↘
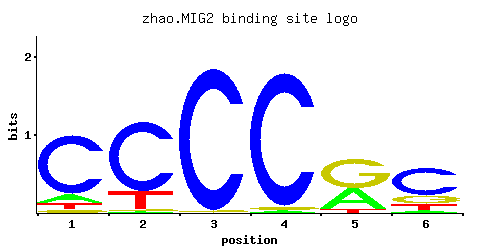
A | 0.116 0.063 0.001 0.002 0.190 0.074
C | 0.184 0.547 0.019 0.013 0.015 0.035
G | 0.643 0.009 0.966 0.983 0.787 0.787
T | 0.057 0.382 0.013 0.003 0.007 0.103
A |  11   6   0   0  19   7
C |  18  54   1   1   1   3
G |  64   0  96  98  78  78
T |   5  38   1   0   0  10
A | -1.01 -1.63 -5.77 -5.08 -0.52 -1.46
C |  0.02  1.11 -2.25 -2.63 -2.48 -1.64
G |  1.27 -3.00  1.68  1.70  1.48  1.48
T | -1.73  0.18 -3.20 -4.67 -3.82 -1.13
Gene-level annotations and interactions.
Genes bound in ChIP-chip experiments 77 genes
YAR009C, YBL068W, YBL070C, YBR032W, YBR065C, YBR109C, YBR110W, YBR120C, YBR185C, YBR186W, YBR232C, YDL091C, YDL092W, YDL094C, YDL245C, YDL246C, YDR030C, YDR031W, YDR117C, YDR118W, YDR136C, YDR138W, YDR164C, YDR165W, YDR294C, YDR343C, YDR355C, YDR411C, YDR412W, YDR473C, YEL069C, YEL070W, YER133W, YER134C, YGL195W, YGR038C-B, YGR188C, YHR005C-A, YIL035C, YIL115C, YJL049W, YJL148W, YJR010C-A, YJR088C, YJR089W, YJR100C, YJR158W, YJR159W, YKL167C, YKR003W, YLL014W, YLR199C, YLR200W, YLR273C, YLR274W, YML072C, YMR052W, YMR131C, YMR283C, YNL111C, YNL136W, YNL137C, YNL210W, YNL211C, YNR054C, YOL023W, YOL083W, YOL099C, YOR021C, YOR059C, YOR214C, YOR307C, YOR365C, YOR367W, YOR368W, YPL267W, YPR134W
Genes affected by TF deletion 26 genes
YEL012W, YMR011W, YPL016W, YMR254C, YMR072W, YNL306W, YER123W, YNL040W, YDR071C, YOL053W, YDL135C, YLR101C, YOR357C, YOR298W, YIR041W, YMR110C, YBR296C, YNL312W, YHR006W, YLR294C, YMR027W, YBR114W, YHR101C, YBR111C, YER100W, YHR197W
Predicted TF–TF partners 3 genes
RGM1, SUT1, USV1