MIG1
YGL035C, TDS22, SSN1, CAT4
Transcription factor involved in glucose repression; sequence specific DNA binding protein containing two Cys2His2 zinc finger motifs; regulated by the SNF1 kinase and the GLC7 phosphatase
Best-performing DNA-binding model.
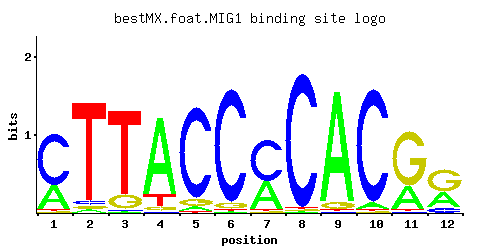
View and copy the recommended matrices ↘
A | 0.30 0.03 0.01 0.83 0.04 0.01 0.39 0.01 0.92 0.05 0.28 0.34
C | 0.68 0.04 0.01 0.01 0.89 0.92 0.60 0.97 0.01 0.93 0.01 0.13
G | 0.01 0.03 0.14 0.04 0.07 0.05 0.01 0.01 0.06 0.01 0.70 0.53
T | 0.01 0.90 0.84 0.12 0.01 0.01 0.01 0.01 0.01 0.01 0.01 0.01
A |  30   3   1  83   4   1  39   1  92   5  28  34
C |  68   4   1   1  89  92  60  97   1  93   1  13
G |   1   3  14   4   7   5   1   1   6   1  70  53
T |   1  90  84  12   1   1   1   1   1   1   1   1
A | -0.06 -2.37 -3.47  0.95 -2.08 -3.47  0.20 -3.47  1.06 -1.86 -0.13  0.06
C |  1.33 -1.50 -2.89 -2.89  1.60  1.63  1.20  1.68 -2.89  1.64 -2.89 -0.33
G | -2.89 -1.79 -0.25 -1.50 -0.94 -1.28 -2.89 -2.89 -1.10 -2.89  1.36  1.08
T | -3.47  1.03  0.97 -0.98 -3.47 -3.47 -3.47 -3.47 -3.47 -3.47 -3.47 -3.47
Alternative candidate matrices 7
Historical matrix candidates from the original ScerTF database. Expand a source to inspect its original logo, scores, and matrix values.
MIG1Badis et. al.P = 0.0001561View matrix ↘
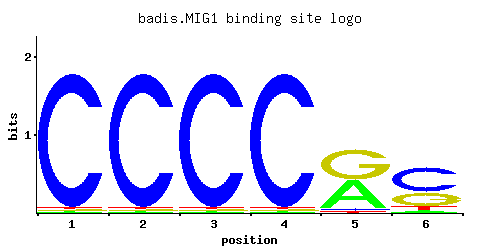
A | 0.01 0.01 0.01 0.01 0.46 0.05
C | 0.97 0.97 0.97 0.97 0.03 0.58
G | 0.01 0.01 0.01 0.01 0.50 0.30
T | 0.01 0.01 0.01 0.01 0.01 0.07
A |   1   1   1   1  46   5
C |  97  97  97  97   3  57
G |   1   1   1   1  50  30
T |   1   1   1   1   1   7
A | -3.47 -3.47 -3.47 -3.47  0.36 -1.86
C |  1.68  1.68  1.68  1.68 -1.79  1.17
G | -2.89 -2.89 -2.89 -2.89  1.02  0.51
T | -3.47 -3.47 -3.47 -3.47 -3.47 -1.52
MIG1_AFoat et. al.P = 0.1674View matrix ↘
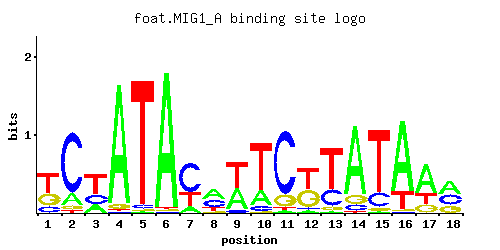
A | 0.01 0.21 0.20 0.77 0.01 0.66 0.49 0.03 0.71 0.51 0.16 0.27 0.01 0.95 0.01 0.52 0.02 0.51
C | 0.25 0.17 0.01 0.04 0.11 0.06 0.41 0.15 0.01 0.01 0.07 0.01 0.01 0.01 0.04 0.01 0.05 0.33
G | 0.34 0.01 0.01 0.18 0.07 0.27 0.05 0.79 0.07 0.07 0.32 0.60 0.01 0.03 0.01 0.24 0.78 0.16
T | 0.40 0.61 0.79 0.01 0.81 0.01 0.05 0.03 0.21 0.41 0.45 0.12 0.97 0.01 0.94 0.23 0.15 0.01
A |   1  21  20  77   1  66  49   3  71  51  16  27   1  95   1  52   2  51
C |  25  17   1   4  11   6  41  15   1   1   7   1   1   1   4   1   5  33
G |  34   1   1  18   7  27   5  79   7   7  32  60   1   3   1  24  78  16
T |  40  61  79   1  81   1   5   3  21  41  45  12  97   1  94  23  15   1
A | -3.47 -0.42 -0.47  0.88 -3.47  0.72  0.43 -2.37  0.80  0.47 -0.69 -0.17 -3.47  1.09 -3.47  0.49 -2.77  0.47
C |  0.33 -0.06 -2.89 -1.50 -0.49 -1.10  0.82 -0.18 -2.89 -2.89 -0.94 -2.89 -2.89 -2.89 -1.50 -2.89 -1.28  0.61
G |  0.64 -2.89 -2.89  0.00 -0.94  0.41 -1.28  1.48 -0.94 -0.94  0.58  1.20 -2.89 -1.79 -2.89  0.29  1.47 -0.12
T |  0.22  0.65  0.90 -3.47  0.93 -3.47 -1.86 -2.37 -0.42  0.25  0.34 -0.98  1.11 -3.47  1.08 -0.33 -0.76 -3.47
MIG1Macisaac et. alP = 3.36e-05View matrix ↘
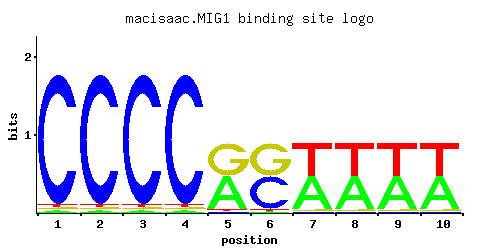
A | 0.488 0.488 0.488 0.488 0.012 0.012 0.012 0.012 0.012 0.012
C | 0.012 0.012 0.012 0.012 0.488 0.488 0.012 0.012 0.012 0.012
G | 0.012 0.012 0.012 0.012 0.488 0.012 0.964 0.964 0.964 0.964
T | 0.488 0.488 0.488 0.488 0.012 0.488 0.012 0.012 0.012 0.012
A |  48  48  48  48   1   1   1   1   1   1
C |   1   1   1   1  48  48   1   1   1   1
G |   1   1   1   1  48   1  96  96  96  96
T |  48  48  48  48   1  48   1   1   1   1
A |  0.42  0.42  0.42  0.42 -3.28 -3.28 -3.28 -3.28 -3.28 -3.28
C | -2.71 -2.71 -2.71 -2.71  1.00  1.00 -2.71 -2.71 -2.71 -2.71
G | -2.71 -2.71 -2.71 -2.71  1.00 -2.71  1.68  1.68  1.68  1.68
T |  0.42  0.42  0.42  0.42 -3.28  0.42 -3.28 -3.28 -3.28 -3.28
MIG1Pachkov et alP = 0.002209View matrix ↘
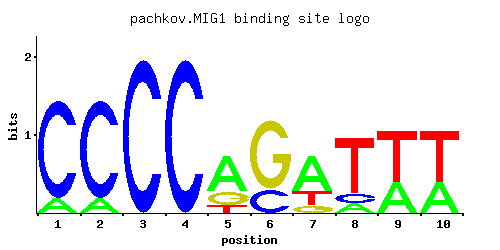
A | 0.125 0.125 0.001 0.001 0.625 0.001 0.625 0.125 0.375 0.375
C | 0.875 0.875 1.000 1.000 0.001 0.250 0.001 0.125 0.001 0.001
G | 0.001 0.001 0.001 0.001 0.250 0.750 0.125 0.001 0.001 0.001
T | 0.001 0.001 0.001 0.001 0.125 0.001 0.250 0.750 0.625 0.625
A |  12  12   0   0  62   0  62  12  37  37
C |  87  87 100 100   0  25   0  12   0   0
G |   0   0   0   0  25  75  12   0   0   0
T |   0   0   0   0  12   0  25  75  62  62
A | -0.94 -0.94 -5.77 -5.77  0.67 -5.77  0.67 -0.94  0.16  0.16
C |  1.58  1.58  1.71  1.71 -5.19  0.33 -5.19 -0.36 -5.19 -5.19
G | -5.19 -5.19 -5.19 -5.19  0.33  1.43 -0.36 -5.19 -5.19 -5.19
T | -5.77 -5.77 -5.77 -5.77 -0.94 -5.77 -0.25  0.85  0.67  0.67
MIG1Zhu J and MQ ZhangP = 3.54e-05View matrix ↘
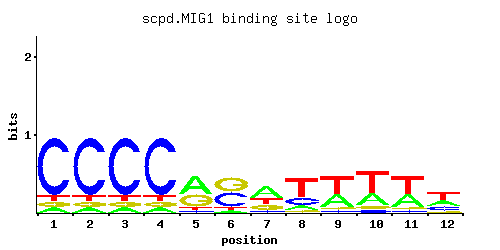
A | 0.07 0.07 0.07 0.07 0.50 0.07 0.50 0.14 0.36 0.29 0.36 0.29
C | 0.79 0.79 0.79 0.79 0.07 0.43 0.07 0.21 0.07 0.07 0.07 0.21
G | 0.07 0.07 0.07 0.07 0.36 0.43 0.21 0.07 0.07 0.07 0.07 0.07
T | 0.07 0.07 0.07 0.07 0.07 0.07 0.21 0.57 0.50 0.57 0.50 0.43
A |   7   7   7   7  50   7  50  14  36  28  36  28
C |  79  79  79  79   7  43   7  21   7   7   7  21
G |   7   7   7   7  36  43  21   7   7   7   7   7
T |   7   7   7   7   7   7  21  56  50  56  50  43
A | -1.52 -1.52 -1.52 -1.52  0.45 -1.52  0.45 -0.83  0.12 -0.10  0.12 -0.10
C |  1.48  1.48  1.48  1.48 -0.94  0.87 -0.94  0.15 -0.94 -0.94 -0.94  0.15
G | -0.94 -0.94 -0.94 -0.94  0.69  0.87  0.15 -0.94 -0.94 -0.94 -0.94 -0.94
T | -1.52 -1.52 -1.52 -1.52 -1.52 -1.52 -0.42  0.58  0.45  0.58  0.45  0.30
MIG1Zhu et. al.P = 2.43e-05View matrix ↘
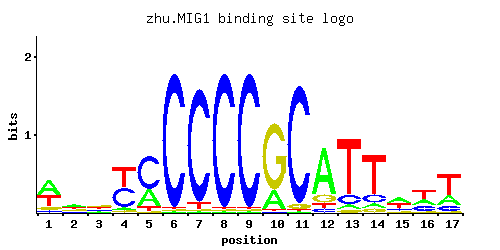
A | 0.57 0.43 0.34 0.71 0.77 0.07 0.01 0.01 0.01 0.01 0.05 0.01 0.08 0.46 0.31 0.27 0.35
C | 0.04 0.05 0.10 0.07 0.04 0.13 0.04 0.77 0.01 0.01 0.01 0.01 0.01 0.04 0.33 0.23 0.11
G | 0.14 0.25 0.18 0.14 0.13 0.06 0.94 0.01 0.97 0.97 0.93 0.97 0.61 0.45 0.19 0.15 0.06
T | 0.26 0.27 0.38 0.08 0.06 0.74 0.01 0.21 0.01 0.01 0.01 0.01 0.30 0.06 0.18 0.36 0.48
A |  56  43  34  71  77   7   1   1   1   1   5   1   8  46  31  27  35
C |   4   5  10   7   4  13   4  77   1   1   1   1   1   4  33  23  11
G |  14  25  18  14  13   6  94   1  97  97  93  97  61  45  19  15   6
T |  26  27  38   8   6  74   1  21   1   1   1   1  30   6  18  36  48
A |  0.58  0.30  0.06  0.80  0.88 -1.52 -3.47 -3.47 -3.47 -3.47 -1.86 -3.47 -1.39  0.36 -0.03 -0.17  0.09
C | -1.50 -1.28 -0.59 -0.94 -1.50 -0.33 -1.50  1.45 -2.89 -2.89 -2.89 -2.89 -2.89 -1.50  0.61  0.25 -0.49
G | -0.25  0.33  0.00 -0.25 -0.33 -1.10  1.65 -2.89  1.68  1.68  1.64  1.68  1.22  0.92  0.05 -0.18 -1.10
T | -0.21 -0.17  0.17 -1.39 -1.67  0.84 -3.47 -0.42 -3.47 -3.47 -3.47 -3.47 -0.06 -1.67 -0.58  0.12  0.41
MIG1Zhao and StormoP = 0.0004727View matrix ↘
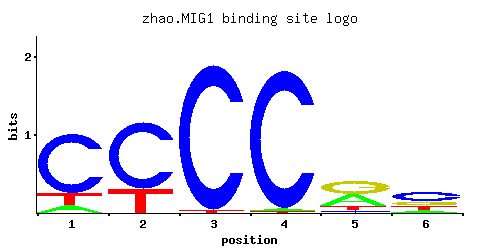
A | 0.162 0.100 0.009 0.012 0.261 0.140
C | 0.234 0.444 0.001 0.001 0.001 0.001
G | 0.491 0.063 0.976 0.986 0.737 0.767
T | 0.113 0.394 0.014 0.001 0.001 0.092
A |  16  10   0   1  26  14
C |  23  44   0   0   0   0
G |  49   6  97  98  73  76
T |  11  39   1   0   0   9
A | -0.68 -1.16 -3.57 -3.28 -0.20 -0.83
C |  0.26  0.90 -5.19 -5.19 -5.19 -5.19
G |  1.00 -1.05  1.69  1.70  1.41  1.45
T | -1.04  0.21 -3.13 -5.77 -5.77 -1.25
Gene-level annotations and interactions.
Genes bound in ChIP-chip experiments 88 genes
YBL029W, YBL043W, YBR120C, YBR277C, YBR279W, YBR280C, YCR073C, YCR082W, YDL089W, YDL090C, YDL149W, YDL151C, YDL154W, YDL189W, YDL190C, YDL246C, YDR028C, YDR029W, YDR040C, YDR041W, YDR441C, YDR442W, YDR535C, YDR536W, YEL069C, YEL070W, YFR023W, YGL050W, YGL121C, YGL170C, YGL171W, YGR083C, YGR165W, YGR241C, YGR243W, YHR062C, YIL099W, YIL170W, YIL171W, YIL172C, YJL023C, YJL216C, YJL219W, YJL221C, YJR054W, YJR056C, YJR135C, YJR159W, YKL132C, YKL208W, YLR074C, YLR075W, YLR229C, YLR241W, YLR272C, YLR339C, YLR341W, YML124C, YMR017W, YMR019W, YMR077C, YMR163C, YMR227C, YMR228W, YMR260C, YNL126W, YNL247W, YNL248C, YOL022C, YOL063C, YOL090W, YOL105C, YOL121C, YOL156W, YOL157C, YOR109W, YOR249C, YPL180W, YPL182C, YPL200W, YPL201C, YPR114W, YPR121W, YPR136C, YPR176C, YPR178W, YPR184W, YPR198W
Genes affected by TF deletion 106 genes
YLR216C, YDR222W, YKL043W, YOR065W, YPL017C, YPL021W, YLR217W, YMR011W, YFR033C, YLR089C, YPL016W, YPL018W, YBR126C, YDR342C, YMR103C, YNR028W, YBR093C, YDR099W, YJR146W, YLL061W, YMR104C, YNL144C, YDR277C, YDR281C, YGR243W, YKL142W, YKR053C, YOR203W, YMR173W, YPL057C, YJR025C, YPL248C, YOR386W, YDR343C, YDR171W, YFL051C, YNL125C, YOL150C, YOR298W, YBR297W, YHR215W, YLR162W, YML091C, YMR291W, YBR069C, YBR071W, YBR101C, YFL052W, YOR298C-A, YPR027C, YOR221C, YAR071W, YBR296C, YER035W, YHR214W-A, YML090W, YBR050C, YHL032C, YLR234W, YML131W, YOL002C, YDR345C, YBR051W, YLR294C, YNL098C, YGR137W, YMR173W-A, YPL061W, YOR394W, YDL048C, YOR383C, YDL242W, YGL157W, YMR300C, YFL054C, YHR096C, YNL160W, YOL151W, YBR298C, YDR297W, YIL067C, YNR044W, YHR018C, YLR270W, YGR146C, YHR136C, YMR182C, YPR159W, YKR098C, YLR269C, YMR062C, YGR177C, YKL067W, YLR081W, YDL023C, YJL012C, YBL051C, YPL134C, YBR089W, YDL022W, YFL036W, YGR086C, YHR104W, YOL101C, YER079W, YML048W
Genes supported by both experiments 1 genes
YGR243W
Predicted TF–TF partners 21 genes
AFT1, AFT2, GIS1, HMS1, MET31, MIG3, MSN2, MSN4, NRG1, PDR1, PDR3, PDR8, RGM1, RGT1, RPH1, RSF2, STP1, STP2, SUT1, UME6, USV1