MET4
YNL103W
Leucine-zipper transcriptional activator, responsible for the regulation of the sulfur amino acid pathway, requires different combinations of the auxiliary factors Cbf1p, Met28p, Met31p and Met32p
Best-performing DNA-binding model.
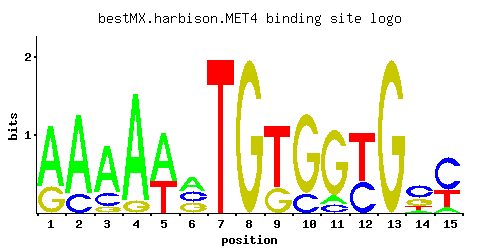
View and copy the recommended matrices ↘
A | 0.697 0.797 0.697 0.899 0.604 0.396 0.001 0.001 0.001 0.001 0.103 0.001 0.001 0.097 0.101
C | 0.001 0.201 0.203 0.001 0.001 0.303 0.001 0.001 0.001 0.195 0.101 0.401 0.001 0.501 0.598
G | 0.303 0.002 0.101 0.100 0.001 0.301 0.001 0.999 0.295 0.804 0.796 0.001 0.999 0.301 0.001
T | 0.001 0.001 0.001 0.001 0.396 0.001 0.999 0.001 0.704 0.001 0.001 0.598 0.001 0.101 0.301
A |  69  79  69  89  60  39   0   0   0   0  10   0   0   9  10
C |   0  20  20   0   0  30   0   0   0  19  10  40   0  50  59
G |  30   0  10  10   0  30   0  99  29  80  79   0  99  30   0
T |   0   0   0   0  39   0  99   0  70   0   0  59   0  10  30
A |  0.78  0.91  0.78  1.03  0.64  0.21 -5.77 -5.77 -5.77 -5.77 -1.13 -5.77 -5.77 -1.19 -1.15
C | -5.19  0.11  0.12 -5.19 -5.19  0.52 -5.19 -5.19 -5.19  0.08 -0.58  0.80 -5.19  1.02  1.20
G |  0.52 -4.50 -0.58 -0.59 -5.19  0.51 -5.19  1.71  0.49  1.50  1.49 -5.19  1.71  0.51 -5.19
T | -5.77 -5.77 -5.77 -5.77  0.21 -5.77  1.14 -5.77  0.79 -5.77 -5.77  0.63 -5.77 -1.15 -0.06
Alternative candidate matrices 5
Historical matrix candidates from the original ScerTF database. Expand a source to inspect its original logo, scores, and matrix values.
MET4_AFoat et. al.P = 8.24e-08View matrix ↘
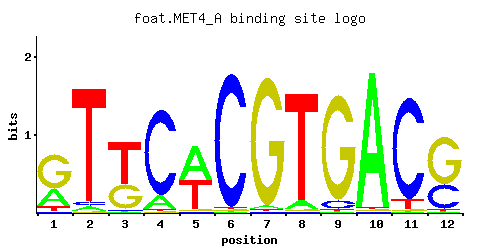
A | 0.29 0.03 0.01 0.13 0.52 0.01 0.02 0.07 0.01 0.97 0.01 0.01
C | 0.01 0.03 0.02 0.85 0.01 0.97 0.01 0.01 0.07 0.01 0.90 0.34
G | 0.62 0.01 0.36 0.01 0.02 0.01 0.96 0.01 0.91 0.01 0.01 0.65
T | 0.08 0.93 0.62 0.01 0.45 0.01 0.01 0.92 0.01 0.01 0.08 0.01
A |  28   3   1  13  52   1   2   7   1  97   1   1
C |   1   3   2  85   1  97   1   1   7   1  90  34
G |  62   1  36   1   2   1  96   1  91   1   1  65
T |   8  93  62   1  45   1   1  92   1   1   8   1
A | -0.10 -2.37 -3.47 -0.90  0.49 -3.47 -2.77 -1.52 -3.47  1.11 -3.47 -3.47
C | -2.89 -1.79 -2.20  1.55 -2.89  1.68 -2.89 -2.89 -0.94 -2.89  1.61  0.64
G |  1.24 -2.89  0.69 -2.89 -2.20 -2.89  1.67 -2.89  1.62 -2.89 -2.89  1.28
T | -1.39  1.07  0.66 -3.47  0.34 -3.47 -3.47  1.06 -3.47 -3.47 -1.39 -3.47
MET4_BFoat et. al.P = 0.0001776View matrix ↘
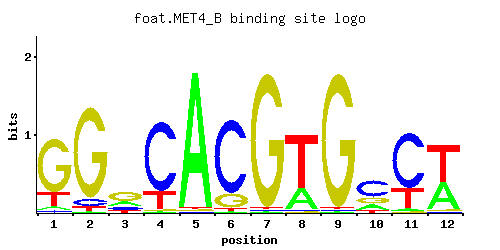
A | 0.56 0.25 0.06 0.01 0.70 0.01 0.02 0.01 0.20 0.11 0.04 0.18
C | 0.02 0.01 0.20 0.97 0.01 0.97 0.16 0.01 0.01 0.49 0.88 0.75
G | 0.01 0.72 0.56 0.01 0.02 0.01 0.82 0.01 0.79 0.17 0.07 0.03
T | 0.41 0.02 0.18 0.01 0.27 0.01 0.01 0.97 0.01 0.23 0.01 0.04
A |  56  25   6   1  70   1   2   1  20  11   4  18
C |   2   1  20  97   1  97  16   1   1  49  88  75
G |   1  72  56   1   2   1  82   1  79  17   7   3
T |  41   2  18   1  27   1   1  97   1  23   1   4
A |  0.56 -0.25 -1.67 -3.47  0.78 -3.47 -2.77 -3.47 -0.47 -1.07 -2.08 -0.58
C | -2.20 -2.89  0.11  1.68 -2.89  1.68 -0.12 -2.89 -2.89  1.00  1.59  1.43
G | -2.89  1.39  1.13 -2.89 -2.20 -2.89  1.52 -2.89  1.48 -0.06 -0.94 -1.79
T |  0.25 -2.77 -0.58 -3.47 -0.17 -3.47 -3.47  1.11 -3.47 -0.33 -3.47 -2.08
MET4Macisaac et. alP = 6.40e-07View matrix ↘
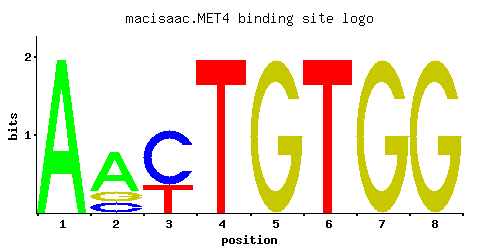
A | 0.997 0.665 0.003 0.001 0.001 0.001 0.001 0.001
C | 0.001 0.166 0.663 0.001 0.001 0.001 0.001 0.001
G | 0.001 0.168 0.001 0.001 0.997 0.001 0.997 0.997
T | 0.001 0.001 0.333 0.997 0.001 0.997 0.001 0.001
A |  99  66   0   0   0   0   0   0
C |   0  16  66   0   0   0   0   0
G |   0  16   0   0  99   0  99  99
T |   0   0  33  99   0  99   0   0
A |  1.14  0.73 -4.67 -5.77 -5.77 -5.77 -5.77 -5.77
C | -5.19 -0.08  1.30 -5.19 -5.19 -5.19 -5.19 -5.19
G | -5.19 -0.07 -5.19 -5.19  1.71 -5.19  1.71  1.71
T | -5.77 -5.77  0.04  1.14 -5.77  1.14 -5.77 -5.77
MET4_AMorozov et. al.P = 8.18e-07View matrix ↘
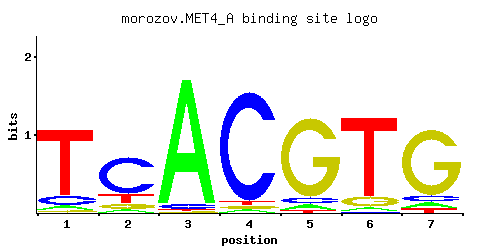
A | 0.056 0.067 0.950 0.022 0.055 0.038 0.063
C | 0.114 0.701 0.036 0.926 0.066 0.014 0.073
G | 0.026 0.087 0.006 0.025 0.853 0.106 0.817
T | 0.804 0.145 0.009 0.027 0.027 0.842 0.047
A |   5   6  95   2   5   3   6
C |  11  70   3  92   6   1   7
G |   2   8   0   2  85  10  81
T |  80  14   0   2   2  84   4
A | -1.74 -1.56  1.09 -2.68 -1.76 -2.13 -1.63
C | -0.46  1.36 -1.61  1.64 -1.00 -2.55 -0.90
G | -1.93 -0.73 -3.40 -1.97  1.56 -0.53  1.51
T |  0.92 -0.79 -3.57 -2.47 -2.47  0.97 -1.92
MET4_BMorozov et. al.P = 6.75e-07View matrix ↘
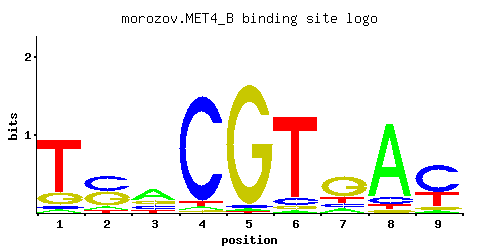
A | 0.286 0.050 0.153 0.854 0.011 0.038 0.100 0.054 0.749
C | 0.070 0.035 0.608 0.047 0.945 0.018 0.211 0.426 0.169
G | 0.599 0.084 0.128 0.076 0.025 0.916 0.177 0.440 0.041
T | 0.045 0.831 0.111 0.023 0.018 0.028 0.512 0.080 0.041
A |  28   5  15  85   1   3  10   5  74
C |   7   3  60   4  94   1  21  42  16
G |  59   8  12   7   2  91  17  44   4
T |   4  83  11   2   1   2  51   8   4
A | -0.11 -1.86 -0.74  0.98 -3.37 -2.13 -1.16 -1.78  0.85
C | -0.94 -1.64  1.22 -1.34  1.66 -2.30  0.16  0.86 -0.06
G |  1.20 -0.76 -0.34 -0.86 -1.97  1.63 -0.02  0.89 -1.48
T | -1.96  0.95 -1.06 -2.63 -2.88 -2.44  0.47 -1.39 -2.05
Gene-level annotations and interactions.
Genes bound in ChIP-chip experiments 58 genes
YAL012W, YBR011C, YBR077C, YBR078W, YDL024C, YDL058W, YDL059C, YER092W, YFR030W, YFR031C, YFR035C, YGL184C, YGR055W, YGR060W, YGR157W, YGR204W, YGR239C, YHR136C, YHR137W, YIL074C, YIR007W, YIR017C, YIR018W, YJL048C, YJL078C, YJL100W, YJL101C, YJL210W, YJL212C, YKL001C, YKR073C, YLL037W, YLL039C, YLL044W, YLL046C, YLR092W, YLR179C, YLR180W, YLR213C, YLR214W, YLR431C, YLR432W, YMR070W, YNL016W, YNL017C, YNL030W, YNL031C, YNL034W, YNL097C, YNL220W, YNL221C, YNL277W, YOR136W, YOR236W, YPL164C, YPL198W, YPR170C, YPR171W
Genes affected by TF deletion 1 genes
No Data
Predicted TF–TF partners 3 genes
CBF1, MET32, TYE7