MET28
YIR017C
Basic leucine zipper (bZIP) transcriptional activator in the Cbf1p-Met4p-Met28p complex, participates in the regulation of sulfur metabolism
Best-performing DNA-binding model.
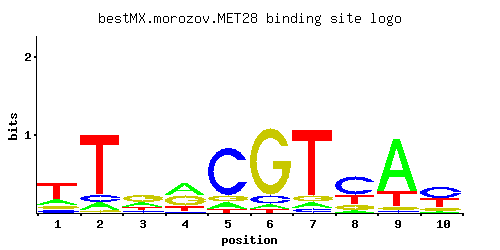
View and copy the recommended matrices ↘
A | 0.193 0.092 0.266 0.415 0.097 0.046 0.061 0.052 0.734 0.061
C | 0.116 0.098 0.120 0.042 0.750 0.097 0.055 0.561 0.024 0.456
G | 0.124 0.024 0.462 0.384 0.102 0.816 0.070 0.144 0.040 0.145
T | 0.568 0.786 0.152 0.159 0.051 0.041 0.815 0.242 0.202 0.338
A |  19   9  26  41   9   4   6   5  73   6
C |  11   9  12   4  75   9   5  56   2  45
G |  12   2  46  38  10  81   7  14   4  14
T |  56  78  15  15   5   4  81  24  20  33
A | -0.51 -1.25 -0.18  0.26 -1.19 -1.94 -1.66 -1.82  0.83 -1.66
C | -0.44 -0.61 -0.41 -1.46  1.43 -0.62 -1.19  1.14 -2.01  0.93
G | -0.37 -2.01  0.94  0.76 -0.57  1.51 -0.94 -0.22 -1.50 -0.22
T |  0.57  0.90 -0.74 -0.70 -1.84 -2.05  0.93 -0.28 -0.46  0.05
Alternative candidate matrices 4
Historical matrix candidates from the original ScerTF database. Expand a source to inspect its original logo, scores, and matrix values.
MET28_AFoat et. al.P = 1View matrix ↘
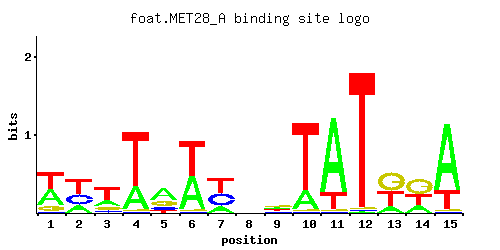
A | 0.41 0.23 0.22 0.29 0.52 0.48 0.19 0.24 0.27 0.21 0.81 0.01 0.15 0.23 0.77
C | 0.02 0.31 0.10 0.01 0.14 0.01 0.38 0.22 0.15 0.01 0.01 0.01 0.01 0.01 0.01
G | 0.13 0.01 0.15 0.01 0.22 0.01 0.01 0.25 0.34 0.01 0.01 0.01 0.49 0.46 0.01
T | 0.44 0.46 0.53 0.69 0.12 0.51 0.43 0.28 0.24 0.77 0.18 0.97 0.36 0.30 0.22
A |  41  23  22  28  52  48  19  24  27  21  81   1  15  23  77
C |   2  31  10   1  14   1  38  22  15   1   1   1   1   1   1
G |  13   1  15   1  22   1   1  25  34   1   1   1  49  46   1
T |  44  46  53  69  12  51  43  28  24  77  18  97  36  30  22
A |  0.25 -0.33 -0.37 -0.10  0.49  0.41 -0.52 -0.29 -0.17 -0.42  0.93 -3.47 -0.76 -0.33  0.88
C | -2.20  0.54 -0.59 -2.89 -0.25 -2.89  0.75  0.20 -0.18 -2.89 -2.89 -2.89 -2.89 -2.89 -2.89
G | -0.33 -2.89 -0.18 -2.89  0.20 -2.89 -2.89  0.33  0.64 -2.89 -2.89 -2.89  1.00  0.94 -2.89
T |  0.32  0.36  0.50  0.77 -0.98  0.47  0.30 -0.13 -0.29  0.88 -0.58  1.11  0.12 -0.06 -0.37
MET28_BFoat et. al.P = 0.001414View matrix ↘
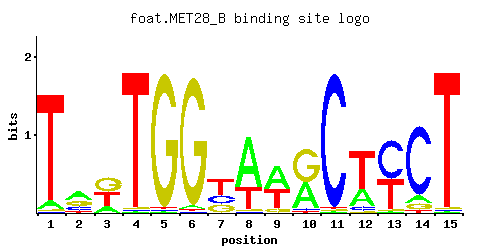
A | 0.97 0.02 0.43 0.64 0.01 0.01 0.40 0.29 0.47 0.01 0.01 0.97 0.40 0.06 0.91
C | 0.01 0.07 0.01 0.01 0.01 0.54 0.10 0.02 0.26 0.96 0.97 0.01 0.42 0.26 0.01
G | 0.01 0.82 0.56 0.07 0.97 0.03 0.01 0.01 0.27 0.01 0.01 0.01 0.01 0.24 0.01
T | 0.01 0.09 0.01 0.28 0.01 0.42 0.49 0.68 0.01 0.02 0.01 0.01 0.18 0.44 0.07
A |  97   2  43  64   1   1  40  28  47   1   1  97  40   6  91
C |   1   7   1   1   1  54  10   2  26  96  97   1  42  26   1
G |   1  82  56   7  97   3   1   1  27   1   1   1   1  24   1
T |   1   9   1  28   1  42  49  68   1   2   1   1  18  44   7
A |  1.11 -2.77  0.30  0.69 -3.47 -3.47  0.22 -0.10  0.38 -3.47 -3.47  1.11  0.22 -1.67  1.05
C | -2.89 -0.94 -2.89 -2.89 -2.89  1.10 -0.59 -2.20  0.37  1.67  1.68 -2.89  0.85  0.37 -2.89
G | -2.89  1.52  1.13 -0.94  1.68 -1.79 -2.89 -2.89  0.41 -2.89 -2.89 -2.89 -2.89  0.29 -2.89
T | -3.47 -1.27 -3.47 -0.13 -3.47  0.27  0.43  0.75 -3.47 -2.77 -3.47 -3.47 -0.58  0.32 -1.52
MET28Macisaac et. alP = 0.2365View matrix ↘
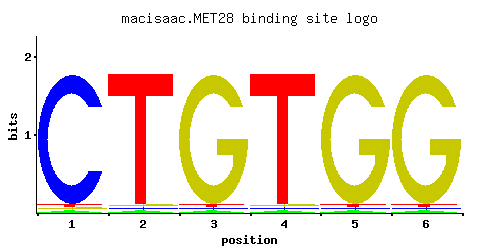
A | 0.012 0.012 0.012 0.012 0.012 0.012
C | 0.964 0.012 0.012 0.012 0.012 0.012
G | 0.012 0.012 0.964 0.012 0.964 0.964
T | 0.012 0.964 0.012 0.964 0.012 0.012
A |   1   1   1   1   1   1
C |  96   1   1   1   1   1
G |   1   1  96   1  96  96
T |   1  96   1  96   1   1
A | -3.28 -3.28 -3.28 -3.28 -3.28 -3.28
C |  1.68 -2.71 -2.71 -2.71 -2.71 -2.71
G | -2.71 -2.71  1.68 -2.71  1.68  1.68
T | -3.28  1.10 -3.28  1.10 -3.28 -3.28
MET28_BMorozov et. al.P = 0.1508View matrix ↘
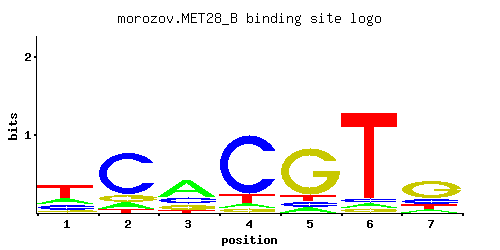
A | 0.222 0.106 0.559 0.057 0.082 0.044 0.106
C | 0.195 0.722 0.199 0.789 0.083 0.045 0.188
G | 0.065 0.120 0.168 0.050 0.749 0.040 0.582
T | 0.518 0.052 0.074 0.104 0.087 0.871 0.124
A |  22  10  55   5   8   4  10
C |  19  72  19  78   8   4  18
G |   6  12  16   5  74   4  58
T |  51   5   7  10   8  87  12
A | -0.37 -1.10  0.56 -1.73 -1.36 -1.98 -1.10
C |  0.08  1.39  0.10  1.48 -0.77 -1.39  0.04
G | -1.02 -0.41 -0.07 -1.28  1.43 -1.50  1.17
T |  0.48 -1.82 -1.46 -1.12 -1.30  1.00 -0.95
Gene-level annotations and interactions.
Genes bound in ChIP-chip experiments 80 genes
YBR122C, YBR124W, YCR081W, YDL050C, YDL089W, YDL090C, YDL149W, YDL151C, YDL192W, YDR030C, YDR031W, YDR048C, YDR098C-A, YDR098C-B, YDR113C, YDR115W, YDR144C, YDR145W, YDR317W, YDR443C, YDR444W, YEL010W, YER087W, YER118C, YER120W, YGR076C, YGR145W, YGR156W, YGR188C, YGR218W, YIL038C, YIL085C, YIL086C, YIL087C, YIL161W, YJR007W, YJR069C, YJR071W, YKL014C, YKL075C, YKL076C, YKL221W, YKL222C, YKR051W, YKR083C, YLR023C, YLR047C, YLR048W, YLR064W, YLR067C, YLR068W, YLR239C, YLR240W, YMR098C, YMR126C, YMR178W, YMR211W, YMR238W, YMR270C, YNL009W, YNL038W, YNL082W, YNL141W, YNL210W, YNL211C, YOL003C, YOL049W, YOL050C, YOL076W, YOL077C, YOL093W, YOL094C, YOR021C, YOR124C, YOR249C, YOR339C, YPL041C, YPL043W, YPR047W, YPR056W
Genes affected by TF deletion 32 genes
YLR216C, YFR033C, YBR093C, YBR129C, YBL058W, YDR281C, YKL142W, YLR183C, YOR011W, YLR099C, YOR074C, YOR298C-A, YDR344C, YNL310C, YNR005C, YNL065W, YDL146W, YDR204W, YDR206W, YGL055W, YNL289W, YDR209C, YPL061W, YKL001C, YML099C, YLR297W, YOR027W, YGL255W, YMR034C, YJL076W, YDL029W, YOL101C
Predicted TF–TF partners 7 genes
MBP1, STB1, STB5, SUM1, SUT1, SWI4, SWI6