← All factors / TF RECORD
MATA2
MATA2, A2
Protein of unknown function, identical to the C-terminal 119 amino acid residues of the MATalpha2 protein; a2 sequence is not present in SGD because the sequenced S288C strain is MATalpha, not MATa
01 / RECOMMENDED MATRIX
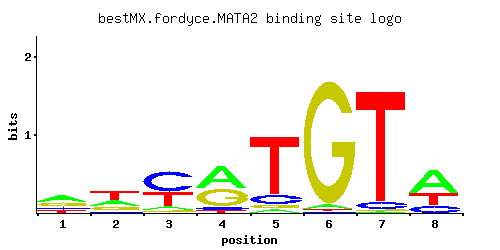
Best-performing DNA-binding model.
Fisher’s P-valueNo data
Information content5.821
Max PWM score6.89
Recommended cutoff5.17
View and copy the recommended matrices ↘
Position frequency matrix (PFM)
A | 0.43 0.27 0.09 0.49 0.04 0.03 0.01 0.55
C | 0.14 0.06 0.54 0.06 0.12 0.01 0.06 0.17
G | 0.30 0.23 0.04 0.41 0.06 0.95 0.01 0.01
T | 0.13 0.44 0.34 0.04 0.78 0.01 0.92 0.27
Position count matrix (PCM)
A |  43  27   9  49   4   3   1  55
C |  14   6  54   6  12   1   6  17
G |  30  23   4  41   6  95   1   1
T |  13  44  34   4  78   1  92  27
Position weight matrix (PWM)
A |  0.30 -0.17 -1.27  0.43 -2.08 -2.37 -3.47  0.54
C | -0.25 -1.10  1.10 -1.10 -0.41 -2.89 -1.10 -0.06
G |  0.51  0.25 -1.50  0.82 -1.10  1.66 -2.89 -2.89
T | -0.90  0.32  0.06 -2.08  0.89 -3.47  1.06 -0.17
02 / COMPARATIVE BENCHMARKS
Alternative candidate matrices 2
Historical matrix candidates from the original ScerTF database. Expand a source to inspect its original logo, scores, and matrix values.
MATA2_AFordyce et. al.P = No dataView matrix ↘
MATA2_BFordyce et. al.P = No dataView matrix ↘
03 / EXPERIMENTAL CONTEXT
Gene-level annotations and interactions.
Genes bound in ChIP-chip experiments 1 genes
No Data
Genes affected by TF deletion 1 genes
No Data
Genes supported by both experiments 1 genes
No Data