MATA1
MATA1, A1
Expressed copy (at MATa) of a1; homeobox-domain protein that, along with alpha2, represses transcription of haploid-specific genes in diploid cells; a1 sequence is not present in SGD because the sequenced S288C strain is MATalpha, not MATa
Best-performing DNA-binding model.
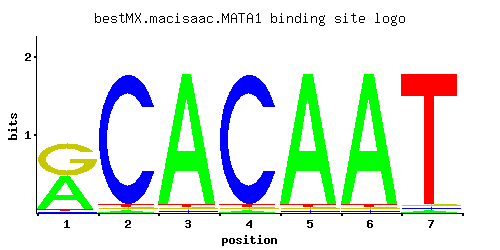
View and copy the recommended matrices ↘
A | 0.488 0.012 0.964 0.012 0.964 0.964 0.012
C | 0.012 0.964 0.012 0.964 0.012 0.012 0.012
G | 0.488 0.012 0.012 0.012 0.012 0.012 0.012
T | 0.012 0.012 0.012 0.012 0.012 0.012 0.964
A |  48   1  96   1  96  96   1
C |   1  96   1  96   1   1   1
G |  48   1   1   1   1   1   1
T |   1   1   1   1   1   1  96
A |  0.42 -3.28  1.10 -3.28  1.10  1.10 -3.28
C | -2.71  1.68 -2.71  1.68 -2.71 -2.71 -2.71
G |  1.00 -2.71 -2.71 -2.71 -2.71 -2.71 -2.71
T | -3.28 -3.28 -3.28 -3.28 -3.28 -3.28  1.10
Alternative candidate matrices 1
Historical matrix candidates from the original ScerTF database. Expand a source to inspect its original logo, scores, and matrix values.
MATA1Foat et. al.P = 2.50e-07View matrix ↘
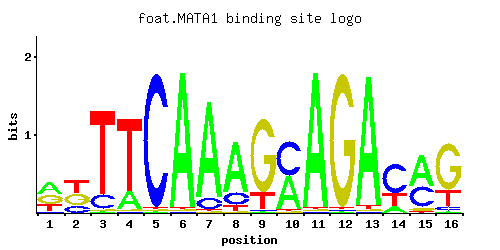
A | 0.23 0.01 0.26 0.02 0.01 0.01 0.01 0.18 0.08 0.01 0.01 0.01 0.80 0.84 0.41 0.23
C | 0.70 0.06 0.01 0.01 0.97 0.01 0.01 0.81 0.01 0.01 0.01 0.01 0.01 0.01 0.35 0.34
G | 0.06 0.37 0.61 0.01 0.01 0.01 0.51 0.01 0.18 0.10 0.01 0.97 0.01 0.14 0.23 0.02
T | 0.01 0.56 0.13 0.96 0.01 0.97 0.48 0.01 0.73 0.88 0.97 0.01 0.19 0.01 0.01 0.41
A |  23   1  26   2   1   1   1  18   8   1   1   1  80  84  41  23
C |  70   6   1   1  97   1   1  81   1   1   1   1   1   1  35  34
G |   6  37  61   1   1   1  51   1  18  10   1  97   1  14  23   2
T |   1  56  13  96   1  97  48   1  73  88  97   1  19   1   1  41
A | -0.33 -3.47 -0.21 -2.77 -3.47 -3.47 -3.47 -0.58 -1.39 -3.47 -3.47 -3.47  0.92  0.97  0.25 -0.33
C |  1.36 -1.10 -2.89 -2.89  1.68 -2.89 -2.89  1.50 -2.89 -2.89 -2.89 -2.89 -2.89 -2.89  0.66  0.64
G | -1.10  0.72  1.22 -2.89 -2.89 -2.89  1.04 -2.89  0.00 -0.59 -2.89  1.68 -2.89 -0.25  0.25 -2.20
T | -3.47  0.56 -0.90  1.10 -3.47  1.11  0.41 -3.47  0.82  1.01  1.11 -3.47 -0.52 -3.47 -3.47  0.25
Gene-level annotations and interactions.
Genes bound in ChIP-chip experiments 79 genes
YBL018C, YBR098W, YBR100W, YBR102C, YBR103W, YBR281C, YBR282W, YCR083W, YDL192W, YDR066C, YDR177W, YDR235W, YDR365C, YDR365W-A, YDR365W-B, YDR367W, YDR372C, YDR373W, YDR473C, YEL002C, YEL018W, YEL019C, YEL055C, YER007W, YER008C, YER009W, YER041W, YER135C, YER183C, YFL029C, YGL170C, YGL233W, YGR024C, YGR128C, YGR129W, YGR151C, YGR152C, YGR153W, YGR166W, YGR167W, YHL002W, YHL003C, YHR005C, YHR074W, YHR109W, YHR118C, YHR119W, YHR120W, YIL048W, YJL155C, YKL078W, YKR010C, YLR222C, YLR277C, YLR368W, YLR426W, YMR066W, YNL010W, YNL011C, YNL101W, YNL105W, YNL187W, YNL245C, YNL253W, YNL254C, YOL077W-A, YOL078W, YOL080C, YOL087C, YOR035C, YOR036W, YOR156C, YOR285W, YOR339C, YPR110C, YPR111W, YPR172W, YPR188C, YPR189W
Genes affected by TF deletion 1 genes
No Data