MAC1
YMR021C, CUA1
Copper-sensing transcription factor involved in regulation of genes required for high affinity copper transport
Best-performing DNA-binding model.
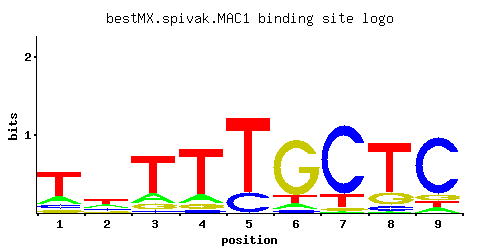
View and copy the recommended matrices ↘
A | 0.178 0.275 0.163 0.133 0.003 0.070 0.016 0.013 0.064
C | 0.107 0.181 0.040 0.043 0.212 0.048 0.804 0.075 0.788
G | 0.090 0.133 0.107 0.090 0.003 0.780 0.033 0.184 0.080
T | 0.624 0.411 0.689 0.734 0.781 0.101 0.147 0.728 0.069
A |  17  27  16  13   0   7   1   1   6
C |  10  18   4   4  21   4  80   7  78
G |   9  13  10   9   0  78   3  18   8
T |  62  41  68  73  78  10  14  72   6
A | -0.59 -0.15 -0.67 -0.88 -4.67 -1.52 -3.00 -3.20 -1.61
C | -0.52  0.01 -1.50 -1.43  0.16 -1.32  1.50 -0.88  1.48
G | -0.69 -0.30 -0.52 -0.69 -4.09  1.47 -1.70  0.02 -0.81
T |  0.67  0.25  0.77  0.83  0.89 -1.15 -0.78  0.82 -1.53
Alternative candidate matrices 5
Historical matrix candidates from the original ScerTF database. Expand a source to inspect its original logo, scores, and matrix values.
MAC1_AFoat et. al.P = 0.0002772View matrix ↘
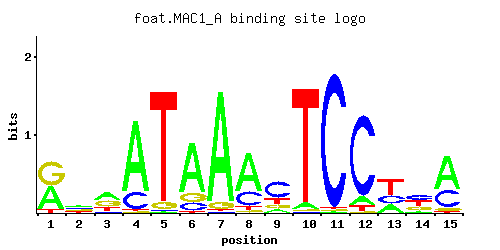
A | 0.44 0.34 0.42 0.79 0.01 0.73 0.92 0.66 0.10 0.05 0.01 0.09 0.26 0.06 0.61
C | 0.01 0.25 0.08 0.20 0.01 0.12 0.01 0.24 0.57 0.01 0.97 0.86 0.26 0.36 0.31
G | 0.49 0.24 0.33 0.01 0.06 0.14 0.06 0.03 0.14 0.01 0.01 0.01 0.01 0.27 0.06
T | 0.07 0.17 0.17 0.01 0.92 0.01 0.01 0.06 0.19 0.93 0.01 0.05 0.48 0.31 0.02
A |  44  34  42  79   1  73  92  66  10   5   1   9  26   6  61
C |   1  25   8  20   1  12   1  24  56   1  97  86  26  36  31
G |  49  24  33   1   6  14   6   3  14   1   1   1   1  27   6
T |   7  17  17   1  92   1   1   6  19  93   1   5  48  31   2
A |  0.32  0.06  0.27  0.90 -3.47  0.82  1.06  0.72 -1.16 -1.86 -3.47 -1.27 -0.21 -1.67  0.65
C | -2.89  0.33 -0.81  0.11 -2.89 -0.41 -2.89  0.29  1.15 -2.89  1.68  1.56  0.37  0.69  0.54
G |  1.00  0.29  0.61 -2.89 -1.10 -0.25 -1.10 -1.79 -0.25 -2.89 -2.89 -2.89 -2.89  0.41 -1.10
T | -1.52 -0.63 -0.63 -3.47  1.06 -3.47 -3.47 -1.67 -0.52  1.07 -3.47 -1.86  0.41 -0.03 -2.77
MAC1_BFoat et. al.P = 1.59e-05View matrix ↘
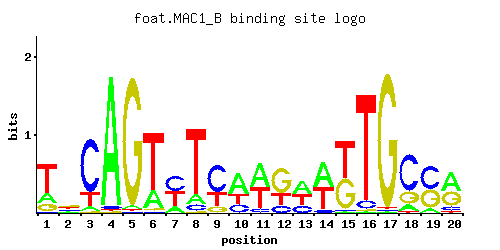
A | 0.20 0.19 0.06 0.96 0.02 0.22 0.17 0.11 0.01 0.54 0.48 0.01 0.40 0.49 0.01 0.01 0.01 0.11 0.09 0.48
C | 0.02 0.20 0.74 0.02 0.01 0.01 0.42 0.08 0.59 0.22 0.08 0.16 0.24 0.07 0.01 0.07 0.01 0.66 0.50 0.12
G | 0.16 0.36 0.01 0.01 0.96 0.03 0.01 0.01 0.13 0.01 0.01 0.58 0.01 0.01 0.45 0.01 0.97 0.22 0.40 0.38
T | 0.62 0.26 0.19 0.01 0.01 0.74 0.40 0.80 0.28 0.23 0.43 0.25 0.35 0.43 0.53 0.91 0.01 0.01 0.01 0.02
A |  20  19   6  96   2  22  17  11   1  54  48   1  40  49   1   1   1  11   9  48
C |   2  20  74   2   1   1  42   8  59  22   8  16  24   7   1   7   1  66  50  12
G |  16  36   1   1  96   3   1   1  13   1   1  57   1   1  45   1  97  22  40  38
T |  62  26  19   1   1  74  40  80  28  23  43  25  35  43  53  91   1   1   1   2
A | -0.47 -0.52 -1.67  1.10 -2.77 -0.37 -0.63 -1.07 -3.47  0.52  0.41 -3.47  0.22  0.43 -3.47 -3.47 -3.47 -1.07 -1.27  0.41
C | -2.20  0.11  1.41 -2.20 -2.89 -2.89  0.85 -0.81  1.19  0.20 -0.81 -0.12  0.29 -0.94 -2.89 -0.94 -2.89  1.30  1.02 -0.41
G | -0.12  0.69 -2.89 -2.89  1.67 -1.79 -2.89 -2.89 -0.33 -2.89 -2.89  1.17 -2.89 -2.89  0.92 -2.89  1.68  0.20  0.80  0.75
T |  0.66 -0.21 -0.52 -3.47 -3.47  0.84  0.22  0.92 -0.13 -0.33  0.30 -0.25  0.09  0.30  0.50  1.05 -3.47 -3.47 -3.47 -2.77
MAC1Harbison et. al.P = 0.0001082View matrix ↘
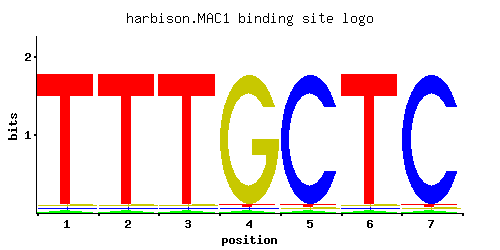
A | 0.012 0.965 0.012 0.012 0.965 0.965 0.965
C | 0.012 0.012 0.012 0.965 0.012 0.012 0.012
G | 0.965 0.012 0.965 0.012 0.012 0.012 0.012
T | 0.012 0.012 0.012 0.012 0.012 0.012 0.012
A |   1  96   1   1  96  96  96
C |   1   1   1  96   1   1   1
G |  96   1  96   1   1   1   1
T |   1   1   1   1   1   1   1
A | -3.28  1.10 -3.28 -3.28  1.10  1.10  1.10
C | -2.71 -2.71 -2.71  1.68 -2.71 -2.71 -2.71
G |  1.68 -2.71  1.68 -2.71 -2.71 -2.71 -2.71
T | -3.28 -3.28 -3.28 -3.28 -3.28 -3.28 -3.28
MAC1Macisaac et. alP = 0.000161View matrix ↘
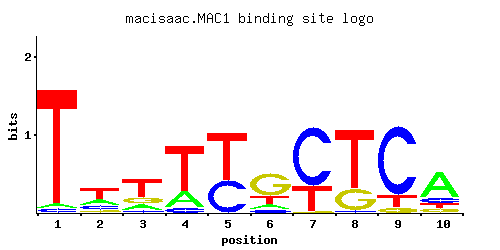
A | 0.116 0.129 0.714 0.289 0.197 0.594 0.682 0.562 0.503 0.928
C | 0.110 0.061 0.264 0.007 0.611 0.001 0.002 0.208 0.085 0.001
G | 0.135 0.806 0.021 0.703 0.091 0.404 0.080 0.060 0.183 0.035
T | 0.639 0.004 0.001 0.001 0.101 0.001 0.236 0.170 0.229 0.036
A |  11  12  71  28  19  59  68  56  50  92
C |  11   6  26   0  61   0   0  20   8   0
G |  13  80   2  70   9  40   8   6  18   3
T |  63   0   0   0  10   0  23  17  22   3
A | -1.01 -0.91  0.80 -0.10 -0.49  0.62  0.76  0.56  0.45  1.06
C | -0.49 -1.08  0.38 -3.25  1.22 -5.19 -4.50  0.14 -0.75 -5.19
G | -0.29  1.50 -2.15  1.36 -0.68  0.81 -0.81 -1.10  0.02 -1.64
T |  0.69 -4.38 -5.77 -5.77 -1.15 -5.77 -0.30 -0.63 -0.33 -2.18
MAC1Pachkov et alP = 0.0001533View matrix ↘
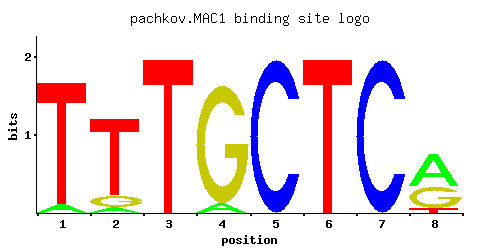
A | 0.062 0.051 0.001 0.068 0.001 0.001 0.001 0.555
C | 0.001 0.001 0.001 0.001 1.000 0.001 1.000 0.001
G | 0.001 0.125 0.001 0.932 0.001 0.001 0.001 0.379
T | 0.938 0.825 1.000 0.001 0.001 1.000 0.001 0.066
A |   6   5   0   6   0   0   0  55
C |   0   0   0   0 100   0 100   0
G |   0  12   0  93   0   0   0  37
T |  93  82 100   0   0 100   0   6
A | -1.64 -1.84 -5.77 -1.55 -5.77 -5.77 -5.77  0.55
C | -5.19 -5.19 -5.19 -5.19  1.71 -5.19  1.71 -5.19
G | -5.19 -0.36 -5.19  1.64 -5.19 -5.19 -5.19  0.74
T |  1.08  0.95  1.14 -5.77 -5.77  1.14 -5.77 -1.58
Gene-level annotations and interactions.
Genes bound in ChIP-chip experiments 134 genes
YAL022C, YAR009C, YAR068W, YAR069C, YBL018C, YBL046W, YBL047C, YBL048W, YBL049W, YBL074C, YBL101W-B, YBR156C, YBR158W, YBR297W, YCL031C, YCR025C, YDL024C, YDL030W, YDL040C, YDL045W-A, YDL128W, YDL184C, YDR058C, YDR355C, YDR506C, YEL032W, YER001W, YER007C-A, YER145C, YER146W, YFR016C, YGL115W, YGL135W, YGL136C, YGL172W, YGL173C, YGL195W, YGL234W, YGL236C, YGR124W, YGR136W, YGR137W, YGR255C, YGR256W, YHL034C, YHR135C, YHR193C, YHR194W, YIL015C-A, YIL102C, YIL112W, YIL135C, YIL159W, YIL160C, YIR020C, YJL006C, YJL048C, YJL052W, YJL148W, YJL217W, YJR041C, YJR042W, YJR049C, YJR050W, YJR100C, YKL063C, YKL080W, YKL118W, YKL127W, YKR073C, YLL058W, YLL059C, YLR035C-A, YLR105C, YLR110C, YLR111W, YLR122C, YLR123C, YLR124W, YLR213C, YLR214W, YLR328W, YLR354C, YLR410W-A, YLR410W-B, YML055W, YML056C, YML071C, YMR188C, YMR189W, YMR319C, YMR320W, YNL016W, YNL017C, YNL034W, YNL097C, YNL111C, YNL250W, YNL251C, YNL255C, YOL022C, YOL077W-A, YOL078W, YOL080C, YOL092W, YOL121C, YOL152W, YOL155C, YOR042W, YOR138C, YOR140W, YOR236W, YOR268C, YOR269W, YOR271C, YPL018W, YPL019C, YPL177C, YPL179W, YPL192C, YPL198W, YPL251W, YPL253C, YPR010C, YPR072W, YPR109W, YPR110C, YPR111W, YPR123C, YPR124W, YPR125W, YPR160W, YPR170C, YPR171W
Genes affected by TF deletion 92 genes
YLR274W, YMR166C, YDR365W-B, YOR038C, YPL014W, YPL016W, YDR128W, YFL041W, YMR103C, YMR105C, YOL104C, YPL283C, YDR276C, YGR250C, YNL339C, YHR050W, YMR104C, YMR106C, YOL105C, YIL015W, YGR296W, YCR021C, YHL050C, YMR022W, YOR229W, YOR043W, YOR075W, YER150W, YIL087C, YML120C, YMR023C, YNR066C, YJR148W, YMR084W, YNL123W, YDL234C, YKL145W, YDL040C, YFL050C, YGR008C, YIR035C, YLR343W, YOR324C, YOR354C, YCL027W, YBR296C, YGL112C, YKL212W, YLR129W, YNR038W, YPL087W, YGL027C, YGR138C, YOR051C, YDR419W, YLR258W, YAR027W, YGR139W, YFL026W, YOR361C, YHR219W, YHR070W, YIR043C, YNL160W, YER067W, YGR261C, YML100W-A, YNR044W, YBR054W, YIL102C, YLR297W, YOL004W, YNL233W, YDR055W, YMR034C, YEL037C, YHR135C, YLR049C, YLR452C, YMR181C, YMR250W, YLL026W, YNL167C, YOL164W, YOR343C-B, YBL051C, YCL040W, YCL042W, YLR178C, YMR276W, YFL068W, YLR395C
Genes supported by both experiments 3 genes
YDL040C, YHR135C, YIL102C