HAP3
YBL021C
Subunit of the heme-activated, glucose-repressed Hap2p/3p/4p/5p CCAAT-binding complex, a transcriptional activator and global regulator of respiratory gene expression; contains sequences contributing to both complex assembly and DNA binding
Best-performing DNA-binding model.
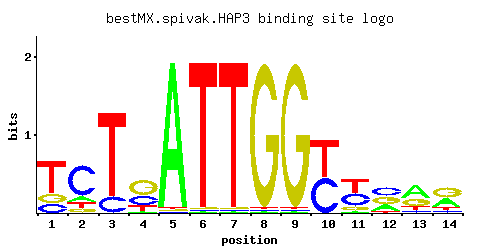
View and copy the recommended matrices ↘
A | 0.005 0.120 0.005 0.032 0.984 0.005 0.005 0.005 0.005 0.005 0.032 0.260 0.489 0.359
C | 0.181 0.675 0.161 0.304 0.005 0.005 0.005 0.005 0.005 0.484 0.400 0.379 0.089 0.089
G | 0.190 0.098 0.005 0.502 0.005 0.005 0.005 0.984 0.984 0.005 0.140 0.332 0.309 0.442
T | 0.624 0.107 0.828 0.163 0.005 0.984 0.984 0.005 0.005 0.505 0.429 0.030 0.112 0.111
A |   0  12   0   3  98   0   0   0   0   0   3  26  48  35
C |  18  67  16  30   0   0   0   0   0  48  40  37   8   8
G |  19   9   0  50   0   0   0  98  98   0  14  33  30  44
T |  62  10  82  16   0  98  98   0   0  50  42   3  11  11
A | -4.16 -0.98 -4.16 -2.30  1.12 -4.16 -4.16 -4.16 -4.16 -4.16 -2.30 -0.21  0.42  0.12
C |  0.01  1.32 -0.11  0.52 -3.58 -3.58 -3.58 -3.58 -3.58  0.99  0.80  0.74 -0.70 -0.70
G |  0.05 -0.61 -3.58  1.03 -3.58 -3.58 -3.58  1.70  1.70 -3.58 -0.25  0.61  0.54  0.90
T |  0.67 -1.10  0.95 -0.67 -4.16  1.12  1.12 -4.16 -4.16  0.46  0.29 -2.37 -1.05 -1.06
Alternative candidate matrices 5
Historical matrix candidates from the original ScerTF database. Expand a source to inspect its original logo, scores, and matrix values.
HAP3Foat et. al.P = 0.000562View matrix ↘
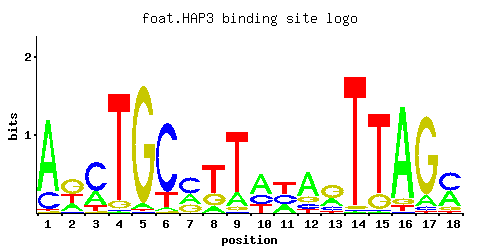
A | 0.02 0.01 0.05 0.83 0.96 0.05 0.07 0.38 0.22 0.77 0.59 0.01 0.16 0.01 0.92 0.10 0.25 0.01
C | 0.12 0.85 0.06 0.16 0.02 0.50 0.17 0.01 0.01 0.05 0.27 0.23 0.01 0.94 0.07 0.02 0.50 0.01
G | 0.49 0.04 0.01 0.01 0.01 0.17 0.14 0.33 0.24 0.01 0.01 0.49 0.80 0.01 0.01 0.61 0.02 0.19
T | 0.38 0.11 0.88 0.01 0.01 0.28 0.62 0.28 0.52 0.17 0.13 0.27 0.03 0.04 0.01 0.27 0.24 0.78
A |   2   1   5  83  96   5   7  38  22  77  59   1  16   1  92  10  25   1
C |  12  85   6  16   2  50  17   1   1   5  27  23   1  94   7   2  50   1
G |  49   4   1   1   1  17  14  33  24   1   1  49  80   1   1  61   2  19
T |  38  11  88   1   1  28  62  28  52  17  13  27   3   4   1  27  24  78
A | -2.77 -3.47 -1.86  0.95  1.10 -1.86 -1.52  0.17 -0.37  0.88  0.61 -3.47 -0.69 -3.47  1.06 -1.16 -0.25 -3.47
C | -0.41  1.55 -1.10 -0.12 -2.20  1.02 -0.06 -2.89 -2.89 -1.28  0.41  0.25 -2.89  1.65 -0.94 -2.20  1.02 -2.89
G |  1.00 -1.50 -2.89 -2.89 -2.89 -0.06 -0.25  0.61  0.29 -2.89 -2.89  1.00  1.49 -2.89 -2.89  1.22 -2.20  0.05
T |  0.17 -1.07  1.01 -3.47 -3.47 -0.13  0.66 -0.13  0.49 -0.63 -0.90 -0.17 -2.37 -2.08 -3.47 -0.17 -0.29  0.89
HAP3Harbison et. al.P = 0.002188View matrix ↘
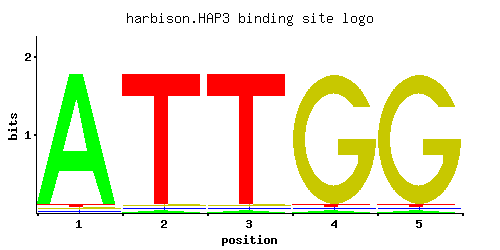
A | 0.012 0.012 0.965 0.965 0.012
C | 0.965 0.965 0.012 0.012 0.012
G | 0.012 0.012 0.012 0.012 0.012
T | 0.012 0.012 0.012 0.012 0.965
A |   1   1  96  96   1
C |  96  96   1   1   1
G |   1   1   1   1   1
T |   1   1   1   1  96
A | -3.28 -3.28  1.10  1.10 -3.28
C |  1.68  1.68 -2.71 -2.71 -2.71
G | -2.71 -2.71 -2.71 -2.71 -2.71
T | -3.28 -3.28 -3.28 -3.28  1.10
HAP3Macisaac et. alP = 0.002188View matrix ↘
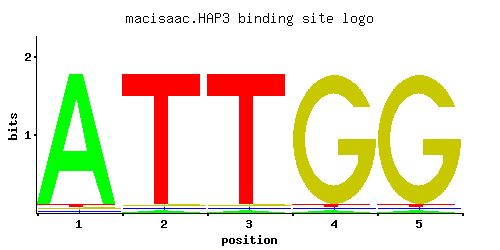
A | 0.012 0.012 0.964 0.964 0.012
C | 0.964 0.964 0.012 0.012 0.012
G | 0.012 0.012 0.012 0.012 0.012
T | 0.012 0.012 0.012 0.012 0.964
A |   1   1  96  96   1
C |  96  96   1   1   1
G |   1   1   1   1   1
T |   1   1   1   1  96
A | -3.28 -3.28  1.10  1.10 -3.28
C |  1.68  1.68 -2.71 -2.71 -2.71
G | -2.71 -2.71 -2.71 -2.71 -2.71
T | -3.28 -3.28 -3.28 -3.28  1.10
HAP3_APachkov et alP = 0.008391View matrix ↘
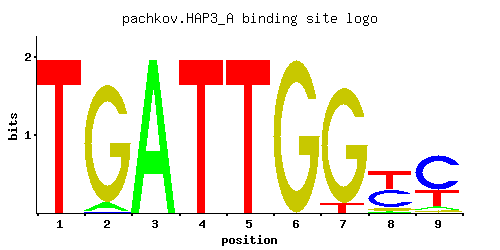
A | 0.001 0.060 1.000 0.001 0.001 0.001 0.001 0.034 0.051
C | 0.001 0.006 0.001 0.001 0.001 0.001 0.001 0.443 0.637
G | 0.001 0.934 0.001 0.001 0.001 1.000 0.927 0.079 0.035
T | 1.000 0.001 0.001 0.999 0.999 0.001 0.073 0.445 0.277
A |   0   6 100   0   0   0   0   3   5
C |   0   0   0   0   0   0   0  44  63
G |   0  93   0   0   0 100  92   7   3
T | 100   0   0  99  99   0   7  44  27
A | -5.77 -1.67  1.14 -5.77 -5.77 -5.77 -5.77 -2.24 -1.84
C | -5.19 -3.40 -5.19 -5.19 -5.19 -5.19 -5.19  0.90  1.26
G | -5.19  1.65 -5.19 -5.19 -5.19  1.71  1.64 -0.82 -1.64
T |  1.14 -5.77 -5.77  1.14  1.14 -5.77 -1.48  0.33 -0.14
HAP3_BPachkov et alP = 1.92e-11View matrix ↘
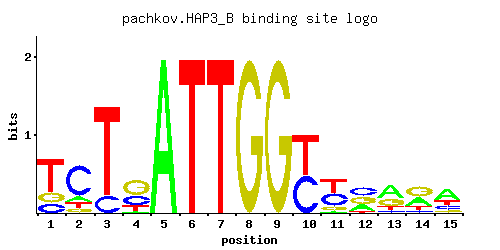
A | 0.001 0.121 0.001 0.033 1.000 0.001 0.001 0.001 0.001 0.001 0.033 0.259 0.489 0.357 0.503
C | 0.182 0.676 0.162 0.304 0.001 0.001 0.001 0.001 0.001 0.489 0.399 0.377 0.089 0.087 0.191
G | 0.190 0.097 0.001 0.499 0.001 0.001 0.001 1.000 1.000 0.001 0.139 0.333 0.308 0.444 0.094
T | 0.628 0.106 0.838 0.164 0.001 1.000 1.000 0.001 0.001 0.511 0.429 0.031 0.114 0.111 0.211
A |   0  12   0   3 100   0   0   0   0   0   3  25  48  35  50
C |  18  67  16  30   0   0   0   0   0  48  39  37   8   8  19
G |  19   9   0  49   0   0   0 100 100   0  13  33  30  44   9
T |  62  10  83  16   0 100 100   0   0  51  42   3  11  11  21
A | -5.77 -0.97 -5.77 -2.27  1.14 -5.77 -5.77 -5.77 -5.77 -5.77 -2.27 -0.21  0.42  0.11  0.45
C |  0.01  1.32 -0.11  0.52 -5.19 -5.19 -5.19 -5.19 -5.19  1.00  0.80  0.74 -0.70 -0.73  0.06
G |  0.05 -0.62 -5.19  1.02 -5.19 -5.19 -5.19  1.71  1.71 -5.19 -0.26  0.62  0.54  0.90 -0.65
T |  0.67 -1.10  0.96 -0.67 -5.77  1.14  1.14 -5.77 -5.77  0.47  0.29 -2.33 -1.03 -1.06 -0.42
Gene-level annotations and interactions.
Genes bound in ChIP-chip experiments 81 genes
YBR039W, YBR216C, YBR217W, YCR028C, YDL045C, YDL170W, YDL171C, YDR030C, YDR031W, YDR084C, YDR130C, YDR146C, YDR147W, YDR282C, YDR292C, YDR372C, YDR373W, YDR377W, YDR503C, YEL004W, YEL005C, YER049W, YER174C, YER175C, YER176W, YER183C, YFR023W, YGL133W, YGL187C, YGL191W, YGL193C, YGL195W, YGR084C, YGR187C, YGR191W, YGR234W, YHR001W-A, YHR028C, YHR044C, YHR045W, YHR051W, YJL023C, YJL060W, YJL096W, YJL097W, YJL145W, YJL148W, YJR077C, YJR078W, YJR079W, YJR082C, YJR100C, YKL039W, YKL040C, YKL072W, YKR103W, YLL027W, YLR211C, YLR220W, YML077W, YML119W, YML120C, YMR065W, YMR125W, YMR126C, YMR258C, YNL009W, YNL232W, YNR006W, YNR054C, YOL023W, YOL105C, YOR106W, YOR112W, YOR138C, YOR140W, YOR258W, YPL207W, YPR158W-A, YPR158W-B, YPR197C
Genes affected by TF deletion 30 genes
YCR016W, YMR220W, YPL053C, YHR179W, YPL016W, YBR093C, YCL018W, YDR281C, YDR442W, YJR148W, YDR506C, YHR215W, YFL014W, YGL214W, YKL120W, YER072W, YER040W, YIL067C, YKL218C, YHR136C, YLR269C, YBR244W, YBR248C, YEL037C, YHR135C, YNL292W, YDL060W, YOR374W, YCL006C, YGL094C