HAP1
YLR256W, CYP1
Zinc finger transcription factor involved in the complex regulation of gene expression in response to levels of heme and oxygen; the S288C sequence differs from other strain backgrounds due to a Ty1 insertion in the carboxy terminus
Best-performing DNA-binding model.
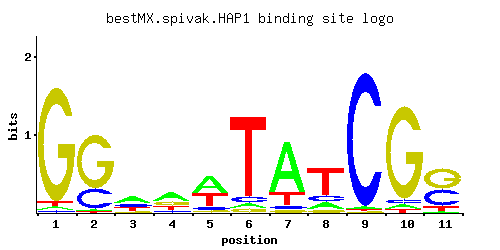
View and copy the recommended matrices ↘
A | 0.021 0.017 0.445 0.462 0.480 0.042 0.738 0.138 0.011 0.040 0.014
C | 0.014 0.261 0.246 0.097 0.085 0.065 0.042 0.143 0.971 0.043 0.396
G | 0.935 0.710 0.101 0.265 0.060 0.039 0.038 0.072 0.008 0.891 0.481
T | 0.030 0.012 0.208 0.176 0.374 0.853 0.183 0.647 0.010 0.026 0.109
A |   2   1  44  46  48   4  73  13   1   4   1
C |   1  26  24   9   8   6   4  14  97   4  39
G |  93  71  10  26   6   3   3   7   0  89  48
T |   3   1  20  17  37  85  18  64   1   2  10
A | -2.72 -2.94  0.33  0.37  0.41 -2.03  0.84 -0.84 -3.37 -2.08 -3.13
C | -2.55  0.37  0.31 -0.62 -0.75 -1.02 -1.46 -0.23  1.69 -1.43  0.79
G |  1.65  1.37 -0.58  0.39 -1.10 -1.53 -1.56 -0.92 -3.11  1.60  0.98
T | -2.37 -3.28 -0.43 -0.60  0.16  0.98 -0.56  0.70 -3.47 -2.51 -1.08
Alternative candidate matrices 6
Historical matrix candidates from the original ScerTF database. Expand a source to inspect its original logo, scores, and matrix values.
HAP1Badis et. al.P = 2.05e-12View matrix ↘
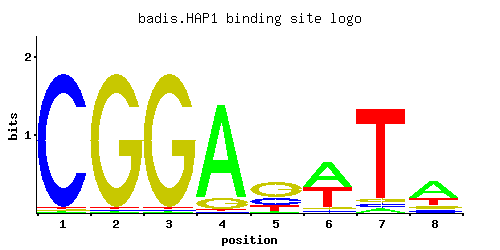
A | 0.01 0.01 0.01 0.87 0.05 0.51 0.04 0.57
C | 0.97 0.01 0.01 0.01 0.26 0.04 0.04 0.11
G | 0.01 0.97 0.97 0.11 0.53 0.04 0.04 0.11
T | 0.01 0.01 0.01 0.01 0.16 0.41 0.88 0.21
A |   1   1   1  87   5  51   4  56
C |  97   1   1   1  26   4   4  11
G |   1  97  97  11  53   4   4  11
T |   1   1   1   1  16  41  88  21
A | -3.47 -3.47 -3.47  1.00 -1.86  0.47 -2.08  0.58
C |  1.68 -2.89 -2.89 -2.89  0.37 -1.50 -1.50 -0.49
G | -2.89  1.68  1.68 -0.49  1.08 -1.50 -1.50 -0.49
T | -3.47 -3.47 -3.47 -3.47 -0.69  0.25  1.01 -0.42
HAP1Foat et. al.P = 1.22e-18View matrix ↘
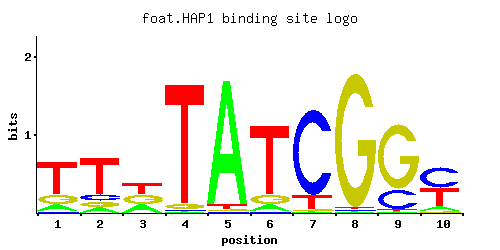
A | 0.42 0.01 0.01 0.13 0.81 0.03 0.94 0.37 0.70 0.65
C | 0.02 0.76 0.97 0.01 0.11 0.01 0.04 0.32 0.09 0.19
G | 0.48 0.22 0.01 0.86 0.01 0.01 0.01 0.01 0.12 0.03
T | 0.09 0.01 0.01 0.01 0.07 0.95 0.01 0.31 0.09 0.13
A |  42   1   1  13  81   3  94  37  70  65
C |   2  76  97   1  11   1   4  32   9  19
G |  48  22   1  86   1   1   1   1  12   3
T |   9   1   1   1   7  95   1  31   9  13
A |  0.27 -3.47 -3.47 -0.90  0.93 -2.37  1.08  0.15  0.78  0.71
C | -2.20  1.44  1.68 -2.89 -0.49 -2.89 -1.50  0.58 -0.69  0.05
G |  0.98  0.20 -2.89  1.56 -2.89 -2.89 -2.89 -2.89 -0.41 -1.79
T | -1.27 -3.47 -3.47 -3.47 -1.52  1.09 -3.47 -0.03 -1.27 -0.90
HAP1Harbison et. al.P = 3.61e-34View matrix ↘
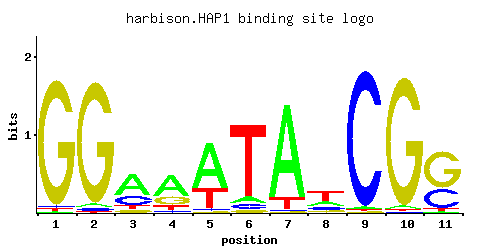
A | 0.009 0.024 0.580 0.583 0.663 0.066 0.871 0.226 0.016 0.025 0.020
C | 0.019 0.021 0.253 0.064 0.033 0.062 0.012 0.172 0.973 0.007 0.329
G | 0.955 0.948 0.076 0.242 0.012 0.040 0.009 0.103 0.004 0.960 0.616
T | 0.017 0.007 0.092 0.111 0.292 0.832 0.107 0.499 0.007 0.008 0.036
A |   0   2  57  58  66   6  87  22   1   2   2
C |   1   2  25   6   3   6   1  17  97   0  32
G |  95  94   7  24   1   4   0  10   0  96  61
T |   1   0   9  11  29  83  10  49   0   0   3
A | -3.57 -2.59  0.59  0.60  0.73 -1.58  1.00 -0.35 -3.00 -2.55 -2.77
C | -2.25 -2.15  0.34 -1.03 -1.70 -1.07 -2.71 -0.05  1.69 -3.25  0.60
G |  1.67  1.66 -0.86  0.30 -2.71 -1.50 -3.00 -0.56 -3.81  1.67  1.23
T | -2.94 -3.82 -1.25 -1.06 -0.09  0.96 -1.10  0.44 -3.82 -3.69 -2.18
HAP1Macisaac et. alP = 6.51e-31View matrix ↘
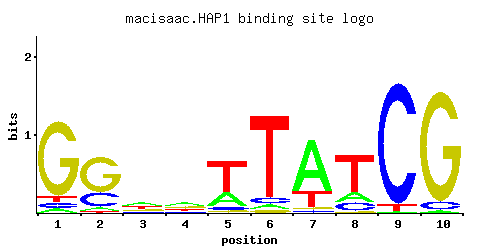
A | 0.001 0.046 0.673 0.217 0.859 0.628 0.204 0.257 0.026 0.054
C | 0.919 0.001 0.014 0.036 0.037 0.039 0.281 0.192 0.648 0.845
G | 0.065 0.943 0.148 0.023 0.063 0.069 0.139 0.155 0.264 0.053
T | 0.015 0.010 0.165 0.724 0.041 0.264 0.376 0.396 0.062 0.048
A |   0   4  67  21  85  62  20  25   2   5
C |  91   0   1   3   3   3  28  19  64  84
G |   6  94  14   2   6   6  13  15  26   5
T |   1   1  16  72   4  26  37  39   6   4
A | -5.77 -1.94  0.74 -0.39  0.99  0.67 -0.45 -0.22 -2.51 -1.78
C |  1.63 -5.19 -2.55 -1.61 -1.58 -1.53  0.45  0.06  1.28  1.55
G | -1.02  1.66 -0.20 -2.06 -1.05 -0.96 -0.26 -0.15  0.38 -1.22
T | -3.06 -3.47 -0.66  0.82 -2.05 -0.19  0.16  0.21 -1.64 -1.90
HAP1Morozov et. al.P = 3.30e-31View matrix ↘
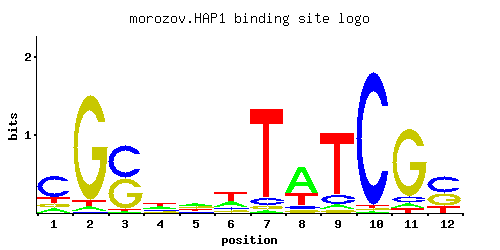
A | 0.108 0.033 0.010 0.310 0.341 0.297 0.018 0.604 0.050 0.007 0.054 0.008
C | 0.619 0.010 0.500 0.239 0.130 0.137 0.069 0.071 0.115 0.969 0.079 0.464
G | 0.120 0.915 0.472 0.127 0.288 0.109 0.039 0.066 0.041 0.012 0.822 0.347
T | 0.153 0.042 0.017 0.324 0.241 0.457 0.875 0.259 0.794 0.013 0.045 0.182
A |  10   3   1  31  34  29   1  60   5   0   5   0
C |  61   1  50  23  13  13   6   7  11  96   7  46
G |  12  91  47  12  28  10   3   6   4   1  82  34
T |  15   4   1  32  24  45  87  25  79   1   4  18
A | -1.09 -2.27 -3.47 -0.03  0.06 -0.07 -2.88  0.64 -1.86 -3.82 -1.78 -3.69
C |  1.24 -2.89  1.02  0.28 -0.33 -0.27 -0.96 -0.93 -0.45  1.68 -0.82  0.95
G | -0.41  1.63  0.96 -0.35  0.47 -0.50 -1.53 -1.00 -1.48 -2.71  1.52  0.66
T | -0.74 -2.03 -2.94  0.01 -0.28  0.36  1.01 -0.21  0.91 -3.20 -1.96 -0.56
HAP1Pachkov et alP = 2.23e-33View matrix ↘
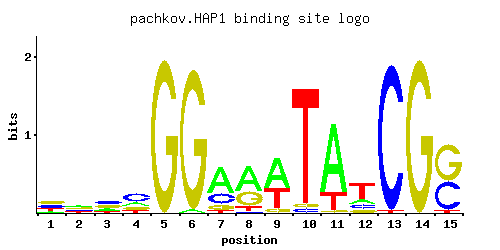
A | 0.028 0.001 0.012 0.567 0.197 0.931 0.365 0.087 0.040 0.001 0.001 0.107 0.110 0.151 0.172
C | 0.550 1.000 0.001 0.121 0.025 0.036 0.084 0.325 0.115 0.979 1.000 0.199 0.320 0.286 0.357
G | 0.422 0.001 0.988 0.149 0.001 0.032 0.001 0.027 0.237 0.001 0.001 0.483 0.338 0.236 0.336
T | 0.001 0.001 0.001 0.163 0.779 0.001 0.551 0.561 0.608 0.021 0.001 0.211 0.232 0.326 0.135
A |   2   0   1  56  19  93  36   8   4   0   0  10  11  15  17
C |  55 100   0  12   2   3   8  32  11  97 100  19  32  28  35
G |  42   0  98  14   0   3   0   2  23   0   0  48  33  23  33
T |   0   0   0  16  77   0  55  56  60   2   0  21  23  32  13
A | -2.44 -5.77 -3.28  0.57 -0.49  1.07  0.13 -1.30 -2.08 -5.77 -5.77 -1.10 -1.07 -0.75 -0.62
C |  1.12  1.71 -5.19 -0.40 -1.97 -1.61 -0.76  0.59 -0.45  1.69  1.71  0.10  0.58  0.46  0.68
G |  0.85 -5.19  1.70 -0.19 -5.19 -1.73 -5.19 -1.90  0.28 -5.19 -5.19  0.99  0.63  0.27  0.62
T | -5.77 -5.77 -5.77 -0.67  0.89 -5.77  0.54  0.56  0.64 -2.72 -5.77 -0.42 -0.32  0.02 -0.86
Gene-level annotations and interactions.
Genes bound in ChIP-chip experiments 215 genes
YAL039C, YAR050W, YBL043W, YBL044W, YBL045C, YBL095W, YBR015C, YBR016W, YBR083W, YCL036W, YCL037C, YCR061W, YCR062W, YDL017W, YDL018C, YDL037C, YDL086W, YDL087C, YDL110C, YDL173W, YDL174C, YDR218C, YDR233C, YDR234W, YDR252W, YDR256C, YDR284C, YDR285W, YDR490C, YDR492W, YDR504C, YDR505C, YDR529C, YDR543C, YDR544C, YDR545W, YEL024W, YEL025C, YEL033W, YEL034W, YEL035C, YEL036C, YEL038W, YEL039C, YER001W, YER044C, YER048C, YER053C, YER141W, YER145C, YER146W, YER189W, YER190W, YFL010W-A, YFL045C, YFL058W, YFR033C, YGL001C, YGL055W, YGL056C, YGL160W, YGL161C, YGL187C, YGL191W, YGL193C, YGL228W, YGL229C, YGR035C, YGR049W, YGR060W, YGR088W, YGR110W, YGR175C, YGR176W, YGR177C, YGR183C, YGR234W, YGR248W, YGR249W, YGR264C, YGR266W, YGR296W, YHL024W, YHR001W-A, YHR005C-A, YHR007C, YHR051W, YHR091C, YHR190W, YIL155C, YIL177C, YIR002C, YIR003W, YJL048C, YJL100W, YJL101C, YJR047C, YJR048W, YJR104C, YJR105W, YKL019W, YKL020C, YKL051W, YKL052C, YKL096W-A, YKL097C, YKL109W, YKL182W, YKL217W, YKR040C, YKR042W, YKR046C, YKR047W, YKR087C, YLL033W, YLL034C, YLR049C, YLR099C, YLR100W, YLR108C, YLR109W, YLR110C, YLR111W, YLR112W, YLR139C, YLR142W, YLR153C, YLR154C, YLR205C, YLR206W, YLR213C, YLR214W, YLR228C, YLR255C, YLR256W, YLR256W-A, YLR325C, YLR326W, YLR342W, YLR395C, YLR410W-A, YLR410W-B, YLR463C, YLR465C, YLR467W, YML007W, YML008C, YML028W, YML036W, YML037C, YML052W, YML053C, YML054C, YML075C, YML076C, YML116W, YML126C, YMR015C, YMR037C, YMR056C, YMR070W, YMR134W, YMR135W-A, YMR145C, YMR201C, YMR202W, YMR220W, YMR238W, YMR251W-A, YMR256C, YMR272C, YMR282C, YMR302C, YNL009W, YNL052W, YNL101W, YNL111C, YNL155W, YNL156C, YNL231C, YNL237W, YNL332W, YNL337W, YNL338W, YNL339C, YNR016C, YNR017W, YNR019W, YNR041C, YNR043W, YNR060W, YOL027C, YOL028C, YOL109W, YOL113W, YOL114C, YOR018W, YOR064C, YOR065W, YOR317W, YOR348C, YOR349W, YOR356W, YPL028W, YPL116W, YPL117C, YPL218W, YPL231W, YPL283C, YPR013C, YPR063C, YPR064W, YPR065W, YPR149W, YPR151C
Genes affected by TF deletion 1 genes
No Data
Predicted TF–TF partners 1 genes
RSF2