HAL9
YOL089C
Putative transcription factor containing a zinc finger; overexpression increases salt tolerance through increased expression of the ENA1 (Na+/Li+ extrusion pump) gene while gene disruption decreases both salt tolerance and ENA1 expression
Best-performing DNA-binding model.
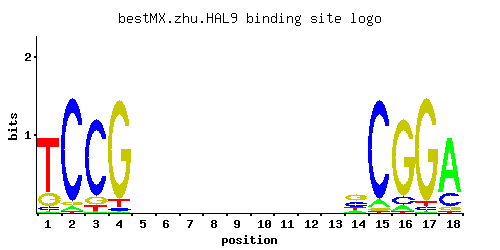
View and copy the recommended matrices ↘
A | 0.01 0.04 0.01 0.01 0.25 0.25 0.25 0.25 0.25 0.25 0.25 0.25 0.25 0.13 0.06 0.06 0.01 0.75
C | 0.06 0.91 0.84 0.03 0.25 0.25 0.25 0.25 0.25 0.25 0.25 0.25 0.25 0.31 0.89 0.09 0.04 0.19
G | 0.19 0.04 0.09 0.89 0.25 0.25 0.25 0.25 0.25 0.25 0.25 0.25 0.25 0.43 0.03 0.84 0.91 0.06
T | 0.75 0.01 0.06 0.06 0.25 0.25 0.25 0.25 0.25 0.25 0.25 0.25 0.25 0.13 0.01 0.01 0.04 0.01
A |   1   4   1   1  25  25  25  25  25  25  25  25  25  13   6   6   1  75
C |   6  91  84   3  25  25  25  25  25  25  25  25  25  31  89   9   4  19
G |  19   4   9  89  25  25  25  25  25  25  25  25  25  43   3  84  91   6
T |  75   1   6   6  25  25  25  25  25  25  25  25  25  13   1   1   4   1
A | -3.47 -2.08 -3.47 -3.47 -0.25 -0.25 -0.25 -0.25 -0.25 -0.25 -0.25 -0.25 -0.25 -0.90 -1.67 -1.67 -3.47  0.85
C | -1.10  1.62  1.54 -1.79  0.33  0.33  0.33  0.33  0.33  0.33  0.33  0.33  0.33  0.54  1.60 -0.69 -1.50  0.05
G |  0.05 -1.50 -0.69  1.60  0.33  0.33  0.33  0.33  0.33  0.33  0.33  0.33  0.33  0.87 -1.79  1.54  1.62 -1.10
T |  0.85 -3.47 -1.67 -1.67 -0.25 -0.25 -0.25 -0.25 -0.25 -0.25 -0.25 -0.25 -0.25 -0.90 -3.47 -3.47 -2.08 -3.47
Alternative candidate matrices 3
Historical matrix candidates from the original ScerTF database. Expand a source to inspect its original logo, scores, and matrix values.
HAL9Badis et. al.P = 0.6667View matrix ↘
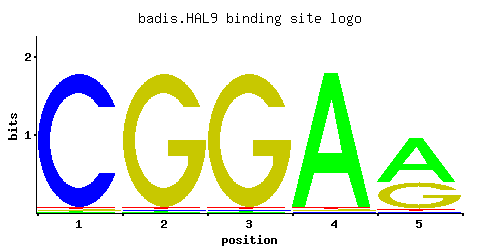
A | 0.01 0.01 0.01 0.97 0.61
C | 0.97 0.01 0.01 0.01 0.01
G | 0.01 0.97 0.97 0.01 0.37
T | 0.01 0.01 0.01 0.01 0.01
A |   1   1   1  97  61
C |  97   1   1   1   1
G |   1  97  97   1  37
T |   1   1   1   1   1
A | -3.47 -3.47 -3.47  1.11  0.65
C |  1.68 -2.89 -2.89 -2.89 -2.89
G | -2.89  1.68  1.68 -2.89  0.72
T | -3.47 -3.47 -3.47 -3.47 -3.47
HAL9Foat et. al.P = 0.07592View matrix ↘
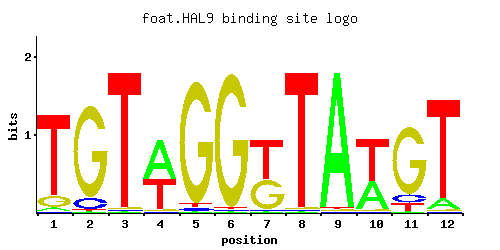
A | 0.03 0.01 0.01 0.56 0.01 0.01 0.01 0.01 0.97 0.39 0.01 0.09
C | 0.01 0.11 0.01 0.01 0.02 0.01 0.01 0.01 0.01 0.01 0.10 0.01
G | 0.12 0.87 0.01 0.01 0.94 0.97 0.43 0.01 0.01 0.01 0.81 0.01
T | 0.84 0.01 0.97 0.42 0.02 0.01 0.56 0.97 0.01 0.59 0.08 0.89
A |   3   1   1  56   1   1   1   1  97  39   1   9
C |   1  11   1   1   2   1   1   1   1   1  10   1
G |  12  87   1   1  94  97  43   1   1   1  81   1
T |  84   1  97  42   2   1  56  97   1  59   8  89
A | -2.37 -3.47 -3.47  0.56 -3.47 -3.47 -3.47 -3.47  1.11  0.20 -3.47 -1.27
C | -2.89 -0.49 -2.89 -2.89 -2.20 -2.89 -2.89 -2.89 -2.89 -2.89 -0.59 -2.89
G | -0.41  1.58 -2.89 -2.89  1.65  1.68  0.87 -2.89 -2.89 -2.89  1.50 -2.89
T |  0.97 -3.47  1.11  0.27 -2.77 -3.47  0.56  1.11 -3.47  0.61 -1.39  1.02
HAL9Zhao and StormoP = 0.2377View matrix ↘
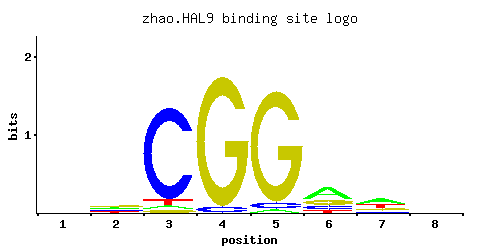
A | 0.256 0.310 0.031 0.001 0.025 0.522 0.424 0.275
C | 0.261 0.188 0.888 0.041 0.050 0.179 0.110 0.259
G | 0.239 0.329 0.029 0.957 0.924 0.210 0.193 0.232
T | 0.244 0.172 0.052 0.001 0.001 0.089 0.273 0.234
A |  25  31   3   0   2  52  42  27
C |  26  18  88   4   5  17  11  25
G |  23  32   2  95  92  21  19  23
T |  24  17   5   0   0   8  27  23
A | -0.22 -0.03 -2.33 -5.77 -2.55  0.49  0.28 -0.15
C |  0.37  0.04  1.60 -1.48 -1.28 -0.01 -0.49  0.36
G |  0.28  0.60 -1.83  1.67  1.64  0.15  0.07  0.25
T | -0.27 -0.62 -1.82 -5.77 -5.77 -1.28 -0.16 -0.31
Gene-level annotations and interactions.
Genes bound in ChIP-chip experiments 80 genes
YCR018C-A, YCR019W, YCR024C, YCR096C, YCR102C, YDL068W, YDL071C, YDR003W, YDR034C-A, YDR042C, YDR078C, YDR079W, YDR084C, YDR086C, YDR098C-A, YDR098C-B, YDR144C, YDR145W, YDR210W-D, YDR434W, YDR495C, YDR520C, YER001W, YER013W, YER044C-A, YER071C, YER072W, YER135C, YGL001C, YGR050C, YGR071C, YGR072W, YGR218W, YGR241C, YGR243W, YGR271W, YGR273C, YGR283C, YHR011W, YHR179W, YIL014W, YJL148W, YJL191W, YJL192C, YJL203W, YJL204C, YJR011C, YJR051W, YKL062W, YKL063C, YLR046C, YLR050C, YLR054C, YLR212C, YLR261C, YLR262C, YLR428C, YLR430W, YLR460C, YMR019W, YMR098C, YMR258C, YMR272C, YNL038W, YNL050C, YNL134C, YNL292W, YNL337W, YOL084W, YOL085C, YOL159C, YOR021C, YOR058C, YPL106C, YPL170W, YPL171C, YPL188W, YPL216W, YPL217C, YPR198W
Genes affected by TF deletion 69 genes
YOR225W, YGL009C, YMR011W, YOR226C, YPL177C, YLR460C, YLL028W, YLL034C, YDR314C, YHR208W, YHR183W, YMR136W, YMR238W, YDR072C, YDR410C, YGL209W, YAL041W, YGL021W, YLR100W, YPL055C, YIL121W, YOR230W, YJR148W, YER001W, YLR101C, YNL220W, YBR102C, YHR089C, YPL008W, YDL198C, YLR128W, YML091C, YMR291W, YFL014W, YLR349W, YMR083W, YDR048C, YDR024W, YDR386W, YKR093W, YMR059W, YBR177C, YKL062W, YOL059W, YJR127C, YKL120W, YDL048C, YDR116C, YJL034W, YMR272C, YLR355C, YNL160W, YOL089C, YOL119C, YPR135W, YER044C, YIL172C, YOR245C, YDR274C, YLR296W, YMR034C, YMR036C, YNL234W, YCR102C, YDR155C, YGR052W, YOL101C, YCL006C, YJR008W
Genes supported by both experiments 5 genes
YCR102C, YER001W, YKL062W, YLR460C, YMR272C