HAC1
YFL031W, IRE15, ERN4
Basic leucine zipper (bZIP) transcription factor (ATF/CREB1 homolog) that regulates the unfolded protein response, via UPRE binding, and membrane biogenesis; ER stress-induced splicing pathway facilitates efficient Hac1p synthesis
Best-performing DNA-binding model.
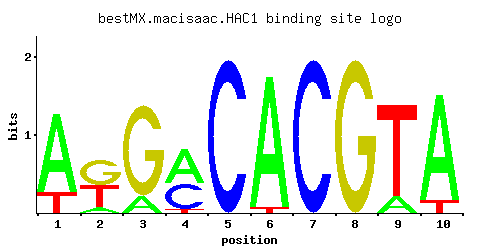
View and copy the recommended matrices ↘
A | 0.794 0.091 0.152 0.544 0.001 0.958 0.001 0.001 0.152 0.895
C | 0.001 0.001 0.001 0.411 0.997 0.001 0.997 0.001 0.001 0.001
G | 0.001 0.495 0.846 0.001 0.001 0.001 0.001 0.997 0.001 0.001
T | 0.204 0.414 0.001 0.044 0.001 0.040 0.001 0.001 0.846 0.103
A |  79   9  15  54   0  95   0   0  15  89
C |   0   0   0  41  99   0  99   0   0   0
G |   0  49  84   0   0   0   0  99   0   0
T |  20  41   0   4   0   4   0   0  84  10
A |  0.91 -1.26 -0.74  0.53 -5.77  1.10 -5.77 -5.77 -0.74  1.03
C | -5.19 -5.19 -5.19  0.83  1.71 -5.19  1.71 -5.19 -5.19 -5.19
G | -5.19  1.01  1.55 -5.19 -5.19 -5.19 -5.19  1.71 -5.19 -5.19
T | -0.45  0.26 -5.77 -1.98 -5.77 -2.08 -5.77 -5.77  0.97 -1.13
Alternative candidate matrices 4
Historical matrix candidates from the original ScerTF database. Expand a source to inspect its original logo, scores, and matrix values.
HAC1Badis et. al.P = 6.71e-07View matrix ↘
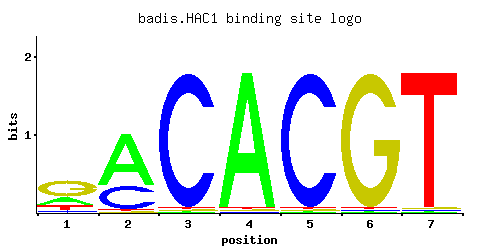
A | 0.24 0.67 0.01 0.97 0.01 0.01 0.01
C | 0.06 0.31 0.97 0.01 0.97 0.01 0.01
G | 0.55 0.01 0.01 0.01 0.01 0.97 0.01
T | 0.15 0.01 0.01 0.01 0.01 0.01 0.97
A |  24  67   1  97   1   1   1
C |   6  31  97   1  97   1   1
G |  55   1   1   1   1  97   1
T |  15   1   1   1   1   1  97
A | -0.29  0.74 -3.47  1.11 -3.47 -3.47 -3.47
C | -1.10  0.54  1.68 -2.89  1.68 -2.89 -2.89
G |  1.12 -2.89 -2.89 -2.89 -2.89  1.68 -2.89
T | -0.76 -3.47 -3.47 -3.47 -3.47 -3.47  1.11
HAC1Foat et. al.P = 2.82e-12View matrix ↘
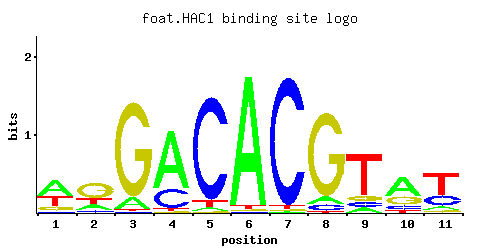
A | 0.52 0.20 0.10 0.73 0.03 0.96 0.01 0.07 0.09 0.56 0.09
C | 0.05 0.06 0.01 0.24 0.91 0.01 0.96 0.06 0.09 0.12 0.28
G | 0.14 0.55 0.88 0.01 0.01 0.01 0.01 0.86 0.10 0.25 0.06
T | 0.30 0.20 0.01 0.02 0.05 0.02 0.02 0.01 0.73 0.06 0.57
A |  52  20  10  73   3  96   1   7   9  56   9
C |   5   6   1  24  91   1  96   6   9  12  28
G |  14  55  88   1   1   1   1  86  10  25   6
T |  30  20   1   2   5   2   2   1  73   6  56
A |  0.49 -0.47 -1.16  0.82 -2.37  1.10 -3.47 -1.52 -1.27  0.56 -1.27
C | -1.28 -1.10 -2.89  0.29  1.62 -2.89  1.67 -1.10 -0.69 -0.41  0.44
G | -0.25  1.12  1.59 -2.89 -2.89 -2.89 -2.89  1.56 -0.59  0.33 -1.10
T | -0.06 -0.47 -3.47 -2.77 -1.86 -2.77 -2.77 -3.47  0.82 -1.67  0.58
HAC1Harbison et. al.P = 0.002528View matrix ↘
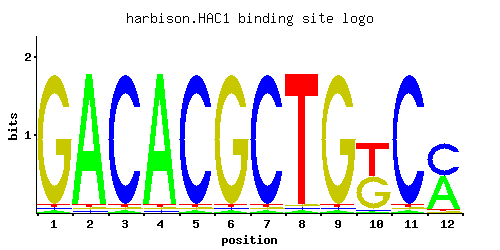
A | 0.012 0.012 0.488 0.012 0.965 0.012 0.012 0.012 0.012 0.012 0.012 0.012
C | 0.012 0.012 0.488 0.964 0.012 0.012 0.964 0.012 0.012 0.012 0.012 0.964
G | 0.488 0.964 0.012 0.012 0.012 0.964 0.012 0.964 0.012 0.964 0.012 0.012
T | 0.488 0.012 0.012 0.012 0.012 0.012 0.012 0.012 0.965 0.012 0.965 0.012
A |   1   1  48   1  96   1   1   1   1   1   1   1
C |   1   1  48  96   1   1  96   1   1   1   1  96
G |  48  96   1   1   1  96   1  96   1  96   1   1
T |  48   1   1   1   1   1   1   1  96   1  96   1
A | -3.28 -3.28  0.42 -3.28  1.10 -3.28 -3.28 -3.28 -3.28 -3.28 -3.28 -3.28
C | -2.71 -2.71  1.00  1.68 -2.71 -2.71  1.68 -2.71 -2.71 -2.71 -2.71  1.68
G |  1.00  1.68 -2.71 -2.71 -2.71  1.68 -2.71  1.68 -2.71  1.68 -2.71 -2.71
T |  0.42 -3.28 -3.28 -3.28 -3.28 -3.28 -3.28 -3.28  1.10 -3.28  1.10 -3.28
HAC1Morozov et. al.P = 0.04993View matrix ↘
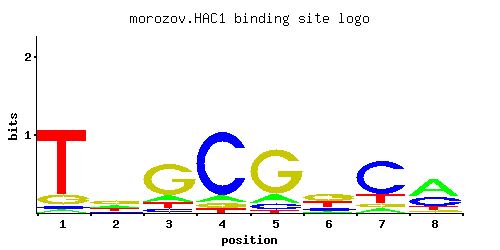
A | 0.036 0.220 0.136 0.071 0.125 0.089 0.076 0.526
C | 0.040 0.136 0.087 0.811 0.107 0.165 0.682 0.307
G | 0.122 0.432 0.679 0.069 0.733 0.412 0.076 0.067
T | 0.802 0.212 0.098 0.049 0.036 0.334 0.167 0.100
A |   3  22  13   7  12   8   7  52
C |   4  13   8  81  10  16  68  30
G |  12  43  67   6  73  41   7   6
T |  80  21   9   4   3  33  16  10
A | -2.18 -0.37 -0.86 -1.51 -0.94 -1.28 -1.44  0.50
C | -1.50 -0.28 -0.73  1.51 -0.52 -0.09  1.33  0.53
G | -0.39  0.88  1.33 -0.96  1.40  0.83 -0.86 -0.99
T |  0.92 -0.41 -1.18 -1.88 -2.18  0.04 -0.65 -1.16
Gene-level annotations and interactions.
Genes bound in ChIP-chip experiments 49 genes
YBL025W, YBR012W-A, YBR012W-B, YBR099C, YBR213W, YCR018C-A, YCR019W, YCR033W, YDL069C, YDL118W, YDL146W, YDR040C, YDR041W, YDR042C, YDR084C, YDR210W-D, YDR217C, YDR540C, YER007C-A, YER129W, YER138C, YFR007W, YFR026C, YFR041C, YFR042W, YGL214W, YGR161W-A, YGR161W-B, YHR044C, YHR045W, YIL048W, YIL139C, YJL034W, YJL035C, YJL175W, YKL071W, YKL165C, YKL177W, YKL179C, YKR061W, YLR404W, YMR178W, YNL044W, YOL023W, YOL030W, YOL031C, YOL115W, YOR058C, YOR143C
Genes affected by TF deletion 16 genes
YBL097W, YDR215C, YFL013W-A, YBR093C, YDR281C, YLR312W-A, YFL031W, YBR105C, YKL214C, YGR164W, YGR168C, YGR111W, YHR132C, YPR068C, YFL032W, YMR034C
Predicted TF–TF partners 2 genes
PHO4, SWI6