← All factors / TF RECORD
GIS1
YDR096W
JmjC domain-containing histone demethylase; transcription factor involved in expression of genes during nutrient limitation and in negative regulation of DPP1 and PHR1; activity is modulated by limited proteasome-mediated proteolysis
01 / RECOMMENDED MATRIX
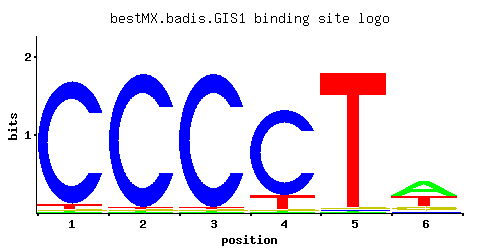
Best-performing DNA-binding model.
Fisher’s P-valueNo data
Information content9.753
Max PWM score8.11
Recommended cutoff6.08
View and copy the recommended matrices ↘
Position frequency matrix (PFM)
A | 0.01 0.01 0.01 0.01 0.01 0.49
C | 0.95 0.97 0.97 0.85 0.01 0.04
G | 0.01 0.01 0.01 0.01 0.01 0.15
T | 0.03 0.01 0.01 0.13 0.97 0.32
Position count matrix (PCM)
A |   1   1   1   1   1  49
C |  95  97  97  85   1   4
G |   1   1   1   1   1  15
T |   3   1   1  13  97  32
Position weight matrix (PWM)
A | -3.47 -3.47 -3.47 -3.47 -3.47  0.43
C |  1.66  1.68  1.68  1.55 -2.89 -1.50
G | -2.89 -2.89 -2.89 -2.89 -2.89 -0.18
T | -2.37 -3.47 -3.47 -0.90  1.11  0.00
02 / COMPARATIVE BENCHMARKS
Alternative candidate matrices 0
Historical matrix candidates from the original ScerTF database. Expand a source to inspect its original logo, scores, and matrix values.
No additional matrices in the original archive.
03 / EXPERIMENTAL CONTEXT
Gene-level annotations and interactions.
Genes bound in ChIP-chip experiments 1 genes
No Data
Genes affected by TF deletion 1 genes
No Data
Genes supported by both experiments 1 genes
No Data
Predicted TF–TF partners 18 genes
GSM1, MIG1, MIG3, NHP10, NRG1, OAF1, PHD1, RDS2, RPH1, RSC3, RSF2, SKN7, SOK2, STP1, SUT1, UGA3, YDR026C, YER184C