GCN4
YEL009C, AAS101, ARG9, AAS3
Basic leucine zipper (bZIP) transcriptional activator of amino acid biosynthetic genes in response to amino acid starvation; expression is tightly regulated at both the transcriptional and translational levels
Best-performing DNA-binding model.
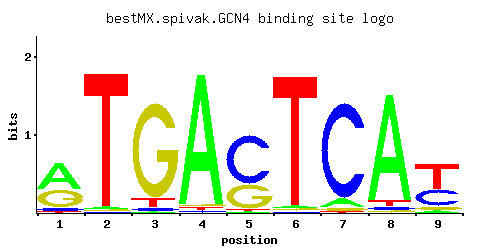
View and copy the recommended matrices ↘
A | 0.547 0.012 0.011 0.964 0.009 0.015 0.073 0.915 0.038
C | 0.059 0.010 0.026 0.012 0.657 0.010 0.891 0.022 0.352
G | 0.363 0.011 0.889 0.013 0.323 0.014 0.024 0.016 0.060
T | 0.031 0.968 0.075 0.012 0.010 0.962 0.013 0.046 0.550
A |  54   1   1  96   0   1   7  91   3
C |   5   1   2   1  65   1  89   2  35
G |  36   1  88   1  32   1   2   1   6
T |   3  96   7   1   1  96   1   4  55
A |  0.54 -3.28 -3.37  1.10 -3.57 -3.06 -1.48  1.05 -2.13
C | -1.12 -2.89 -1.93 -2.71  1.29 -2.89  1.60 -2.10  0.67
G |  0.70 -2.80  1.60 -2.63  0.58 -2.55 -2.01 -2.42 -1.10
T | -2.33  1.11 -1.45 -3.28 -3.47  1.10 -3.20 -1.94  0.54
Alternative candidate matrices 13
Historical matrix candidates from the original ScerTF database. Expand a source to inspect its original logo, scores, and matrix values.
GCN4_AFoat et. al.P = 2.46e-67View matrix ↘
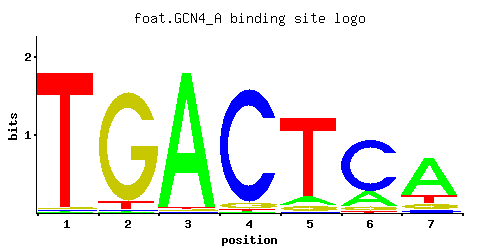
A | 0.14 0.01 0.85 0.01 0.01 0.06 0.97
C | 0.10 0.06 0.06 0.05 0.01 0.92 0.01
G | 0.06 0.73 0.01 0.93 0.01 0.01 0.01
T | 0.70 0.20 0.09 0.01 0.97 0.01 0.01
A |  14   1  85   1   1   6  97
C |  10   6   6   5   1  92   1
G |   6  73   1  93   1   1   1
T |  70  20   9   1  97   1   1
A | -0.83 -3.47  0.98 -3.47 -3.47 -1.67  1.11
C | -0.59 -1.10 -1.10 -1.28 -2.89  1.63 -2.89
G | -1.10  1.40 -2.89  1.64 -2.89 -2.89 -2.89
T |  0.78 -0.47 -1.27 -3.47  1.11 -3.47 -3.47
GCN4_BFoat et. al.P = 2.46e-67View matrix ↘
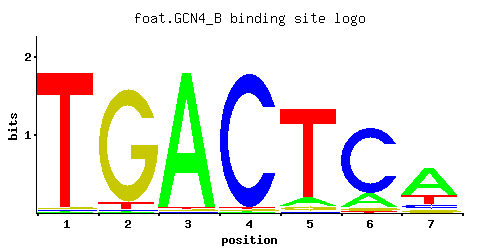
A | 0.19 0.01 0.87 0.01 0.01 0.05 0.97
C | 0.07 0.04 0.04 0.01 0.01 0.93 0.01
G | 0.10 0.79 0.01 0.97 0.01 0.01 0.01
T | 0.64 0.16 0.08 0.01 0.97 0.01 0.01
A |  19   1  87   1   1   5  97
C |   7   4   4   1   1  93   1
G |  10  79   1  97   1   1   1
T |  64  16   8   1  97   1   1
A | -0.52 -3.47  1.00 -3.47 -3.47 -1.86  1.11
C | -0.94 -1.50 -1.50 -2.89 -2.89  1.64 -2.89
G | -0.59  1.48 -2.89  1.68 -2.89 -2.89 -2.89
T |  0.69 -0.69 -1.39 -3.47  1.11 -3.47 -3.47
GCN4_CFoat et. al.P = 1.95e-76View matrix ↘
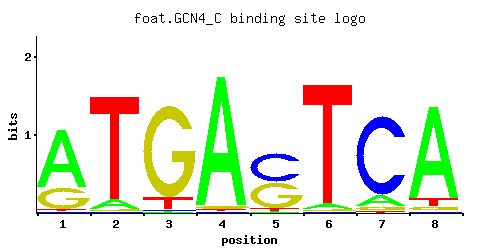
A | 0.72 0.08 0.01 0.96 0.02 0.04 0.11 0.87
C | 0.01 0.01 0.01 0.01 0.50 0.01 0.85 0.01
G | 0.27 0.01 0.87 0.02 0.45 0.01 0.04 0.04
T | 0.01 0.90 0.11 0.01 0.03 0.94 0.01 0.07
A |  72   8   1  96   2   4  11  87
C |   1   1   1   1  50   1  85   1
G |  27   1  87   2  45   1   4   4
T |   1  90  11   1   3  94   1   7
A |  0.81 -1.39 -3.47  1.10 -2.77 -2.08 -1.07  1.00
C | -2.89 -2.89 -2.89 -2.89  1.02 -2.89  1.55 -2.89
G |  0.41 -2.89  1.58 -2.20  0.92 -2.89 -1.50 -1.50
T | -3.47  1.03 -1.07 -3.47 -2.37  1.08 -3.47 -1.52
GCN4_AFordyce et. al.P = 1.31e-15View matrix ↘
GCN4_BFordyce et. al.P = 1.55e-69View matrix ↘
GCN4_CFordyce et. al.P = 2.14e-76View matrix ↘
GCN4Harbison et. al.P = 8.20e-68View matrix ↘
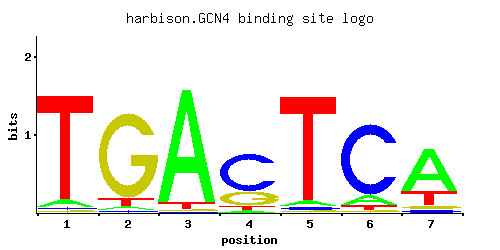
A | 0.059 0.036 0.927 0.029 0.044 0.101 0.697
C | 0.017 0.022 0.008 0.662 0.027 0.827 0.043
G | 0.015 0.866 0.012 0.251 0.018 0.029 0.045
T | 0.908 0.077 0.054 0.058 0.911 0.043 0.214
A |   5   3  92   2   4  10  69
C |   1   2   0  66   2  82   4
G |   1  86   1  25   1   2   4
T |  90   7   5   5  91   4  21
A | -1.69 -2.18  1.06 -2.40 -1.98 -1.15  0.78
C | -2.36 -2.10 -3.11  1.30 -1.90  1.52 -1.43
G | -2.48  1.57 -2.71  0.33 -2.30 -1.83 -1.39
T |  1.04 -1.42 -1.78 -1.71  1.05 -2.01 -0.40
GCN4Macisaac et. alP = 1.60e-79View matrix ↘
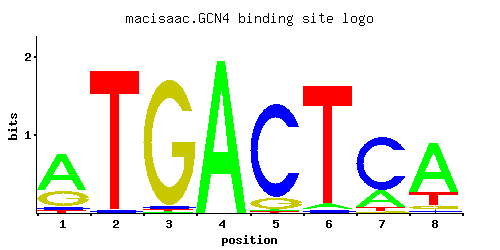
A | 0.642 0.003 0.008 0.995 0.011 0.042 0.218 0.735
C | 0.050 0.021 0.025 0.001 0.875 0.021 0.729 0.029
G | 0.274 0.001 0.957 0.003 0.106 0.001 0.009 0.056
T | 0.034 0.975 0.010 0.001 0.008 0.936 0.044 0.180
A |  64   0   0  99   1   4  21  73
C |   5   2   2   0  87   2  72   2
G |  27   0  95   0  10   0   0   5
T |   3  97   1   0   0  93   4  18
A |  0.70 -4.67 -3.69  1.13 -3.37 -2.03 -0.38  0.83
C | -1.28 -2.15 -1.97 -5.19  1.58 -2.15  1.40 -1.83
G |  0.42 -5.19  1.67 -4.09 -0.53 -5.19 -3.00 -1.17
T | -2.24  1.11 -3.47 -5.77 -3.69  1.07 -1.98 -0.58
GCN4Morozov et. al.P = 1.72e-86View matrix ↘
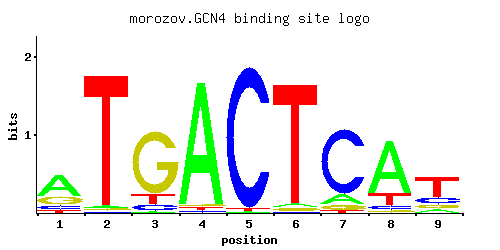
A | 0.587 0.015 0.014 0.949 0.007 0.028 0.112 0.753 0.095
C | 0.116 0.010 0.073 0.016 0.980 0.007 0.802 0.057 0.187
G | 0.231 0.012 0.793 0.019 0.001 0.023 0.065 0.034 0.123
T | 0.066 0.962 0.120 0.016 0.012 0.942 0.020 0.155 0.595
A |  58   1   1  94   0   2  11  75   9
C |  11   1   7   1  98   0  80   5  18
G |  23   1  79   1   0   2   6   3  12
T |   6  96  12   1   1  94   2  15  59
A |  0.61 -3.06 -3.13  1.09 -3.82 -2.44 -1.05  0.86 -1.21
C | -0.44 -2.89 -0.90 -2.42  1.69 -3.25  1.49 -1.15  0.04
G |  0.25 -2.71  1.48 -2.25 -5.19 -2.06 -1.02 -1.67 -0.38
T | -1.58  1.10 -0.98 -3.00 -3.28  1.08 -2.77 -0.72  0.62
GCN4Pachkov et alP = 1.92e-55View matrix ↘
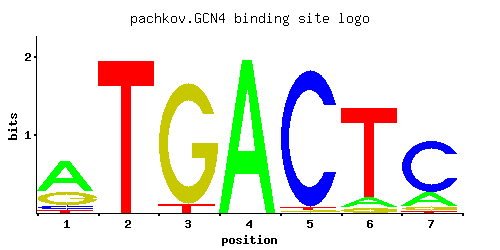
A | 0.017 0.868 0.011 0.001 0.061 0.997 0.032
C | 0.053 0.047 0.011 0.001 0.939 0.001 0.280
G | 0.737 0.001 0.975 0.001 0.001 0.003 0.076
T | 0.193 0.085 0.003 1.000 0.001 0.001 0.612
A |   1  86   1   0   6  99   3
C |   5   4   1   0  93   0  28
G |  73   0  97   0   0   0   7
T |  19   8   0 100   0   0  61
A | -2.94  1.00 -3.37 -5.77 -1.66  1.14 -2.30
C | -1.22 -1.34 -2.80 -5.19  1.65 -5.19  0.44
G |  1.41 -5.19  1.69 -5.19 -5.19 -4.09 -0.86
T | -0.51 -1.33 -4.67  1.14 -5.77 -5.77  0.65
GCN4Zhu J and MQ ZhangP = 2.36e-55View matrix ↘
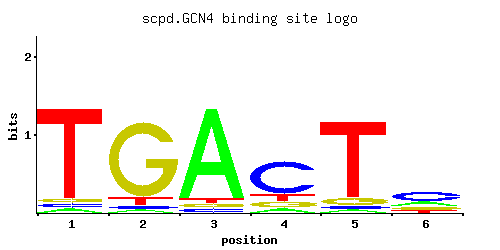
A | 0.04 0.04 0.88 0.08 0.04 0.23
C | 0.04 0.04 0.04 0.69 0.04 0.50
G | 0.04 0.85 0.04 0.12 0.08 0.15
T | 0.88 0.08 0.04 0.12 0.85 0.12
A |   4   4  88   8   4  23
C |   4   4   4  69   4  50
G |   4  85   4  12   8  15
T |  88   8   4  12  85  12
A | -2.08 -2.08  1.01 -1.39 -2.08 -0.33
C | -1.50 -1.50 -1.50  1.34 -1.50  1.02
G | -1.50  1.55 -1.50 -0.41 -0.81 -0.18
T |  1.01 -1.39 -2.08 -0.98  0.98 -0.98
GCN4Zhu et. al.P = 1.31e-76View matrix ↘
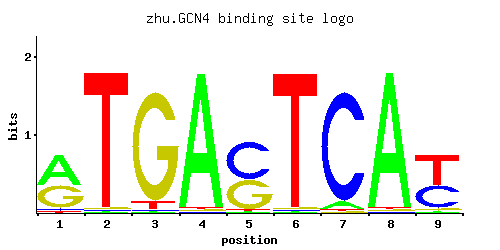
A | 0.54 0.01 0.01 0.96 0.01 0.01 0.06 0.97 0.02
C | 0.04 0.01 0.01 0.01 0.43 0.01 0.92 0.01 0.41
G | 0.41 0.01 0.92 0.01 0.55 0.01 0.01 0.01 0.04
T | 0.02 0.97 0.06 0.01 0.01 0.96 0.01 0.01 0.54
A |  54   1   1  96   1   1   6  97   2
C |   4   1   1   1  43   1  92   1  41
G |  41   1  92   1  55   1   1   1   4
T |   2  97   6   1   1  96   1   1  54
A |  0.52 -3.47 -3.47  1.10 -3.47 -3.47 -1.67  1.11 -2.77
C | -1.50 -2.89 -2.89 -2.89  0.87 -2.89  1.63 -2.89  0.82
G |  0.82 -2.89  1.63 -2.89  1.12 -2.89 -2.89 -2.89 -1.50
T | -2.77  1.11 -1.67 -3.47 -3.47  1.10 -3.47 -3.47  0.52
GCN4Zhao and StormoP = 1.98e-46View matrix ↘
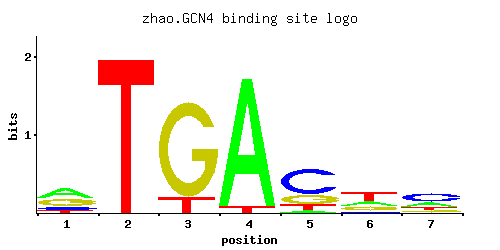
A | 0.440 0.001 0.001 0.950 0.049 0.225 0.230
C | 0.125 0.001 0.001 0.001 0.621 0.089 0.483
G | 0.346 0.001 0.860 0.001 0.211 0.220 0.130
T | 0.089 0.997 0.138 0.048 0.118 0.466 0.156
A |  44   0   0  95   4  22  23
C |  12   0   0   0  62   8  48
G |  34   0  86   0  21  22  13
T |   8  99  13   4  11  46  15
A |  0.32 -5.77 -5.77  1.09 -1.88 -0.35 -0.33
C | -0.36 -5.19 -5.19 -5.19  1.24 -0.70  0.99
G |  0.65 -5.19  1.56 -5.19  0.16  0.20 -0.33
T | -1.28  1.14 -0.84 -1.90 -1.00  0.38 -0.72
Gene-level annotations and interactions.
Genes bound in ChIP-chip experiments 143 genes
YBL001C, YBL059W, YBL076C, YBR043C, YBR048W, YBR104W, YBR112C, YBR114W, YBR115C, YBR144C, YBR145W, YBR218C, YBR248C, YBR249C, YBR250W, YBR256C, YBR257W, YCL002C, YCL006C, YCL007C, YCL008C, YCL009C, YCL010C, YCL030C, YCR002C, YCR004C, YCR005C, YCR006C, YCR008W, YCR012W, YCR096C, YDL044C, YDL054C, YDL170W, YDL171C, YDL182W, YDL198C, YDR034C, YDR035W, YDR042C, YDR084C, YDR125C, YDR126W, YDR127W, YDR144C, YDR145W, YDR341C, YDR354W, YDR481C, YEL001C, YEL062W, YEL063C, YER052C, YER055C, YER069W, YER073W, YER085C, YER086W, YER089C, YER090W, YGL125W, YGL184C, YGL202W, YGL234W, YGL236C, YGR071C, YGR072W, YGR094W, YGR218W, YGR267C, YGR269W, YGR271W, YHR018C, YHR071W, YHR161C, YHR162W, YJL003W, YJL004C, YJL071W, YJL072C, YJL088W, YJL200C, YJR016C, YJR018W, YJR025C, YJR026W, YJR027W, YJR028W, YJR029W, YJR109C, YJR110W, YJR111C, YJR112W, YKL015W, YKL016C, YKL211C, YLL004W, YLL005C, YLR261C, YLR262C, YLR302C, YLR355C, YLR356W, YLR451W, YMR019W, YMR062C, YMR063W, YMR095C, YMR096W, YNL004W, YNL005C, YNL103W, YNL104C, YNL309W, YNL311C, YNL337W, YNR050C, YOL058W, YOL064C, YOL119C, YOL140W, YOL160W, YOR108W, YOR130C, YOR201C, YOR202W, YOR203W, YOR204W, YOR221C, YOR222W, YOR302W, YOR303W, YOR337W, YPL111W, YPL188W, YPL252C, YPL273W, YPR038W, YPR039W, YPR040W, YPR110C, YPR111W, YPR185W
Genes affected by TF deletion 113 genes
YCR040W, YDR068W, YGR280C, YOR225W, YDL131W, YGL009C, YPL019C, YDR035W, YMR044W, YOR226C, YHR143W-A, YJL052W, YOR382W, YGR063C, YOL142W, YOR285W, YOR287C, YOR351C, YPL187W, YDL222C, YER024W, YHR208W, YBR091C, YBR093C, YDR461W, YFR008W, YHR021C, YJR146W, YNL146W, YOR288C, YCL018W, YDR281C, YIL015W, YLR185W, YML055W, YMR287C, YER109C, YCL065W, YPL183W-A, YDL106C, YKL054C, YOR045W, YBR011C, YNL027W, YJR148W, YER001W, YLR348C, YOL144W, YBL062W, YGR192C, YKL209C, YKL178C, YLR343W, YLR349W, YNL150W, YOL143C, YKL177W, YLR234W, YOR239W, YKL058W, YLR040C, YLR420W, YNL259C, YOR393W, YCL066W, YHR005C-A, YOR210W, YDR235W, YKL120W, YLR041W, YOR020C, YOR054C, YFL026W, YFL059W, YFL030W, YHR072W-A, YLR388W, YNL195C, YOR383C, YDR322C-A, YGL089C, YBR145W, YNL162W, YPL281C, YBL042C, YGR233C, YJR004C, YKL216W, YDR056C, YHR018C, YLR303W, YAL033W, YER019C-A, YHR136C, YHR141C, YBR053C, YCR028C-A, YIL105C, YLR302C, YNL070W, YAR044W, YGL032C, YGL004C, YHR140W, YBR118W, YJR135W-A, YJR009C, YEL009C, YCL039W, YBR276C, YCL006C, YML081C-A, YOR182C
Genes supported by both experiments 5 genes
YBR145W, YCL006C, YDR035W, YHR018C, YLR302C
Predicted TF–TF partners 10 genes
ABF1, ACA1, ARG80, BAS1, CBF1, LEU3, RSC3, RTG3, STB3, TYE7