← All factors / TF RECORD
GAT4
YIR013C
Protein containing GATA family zinc finger motifs
01 / RECOMMENDED MATRIX
Best-performing DNA-binding model.
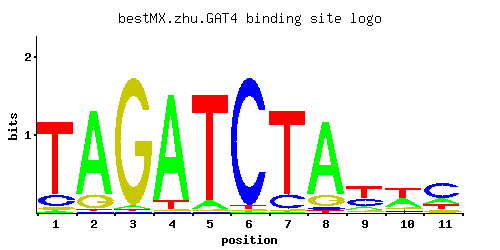
Fisher’s P-valueNo data
Information content11.27
Max PWM score11.18
Recommended cutoff8.38
View and copy the recommended matrices ↘
Position frequency matrix (PFM)
A | 0.02 0.84 0.02 0.91 0.07 0.01 0.01 0.82 0.12 0.37 0.19
C | 0.13 0.01 0.01 0.01 0.01 0.96 0.14 0.03 0.30 0.10 0.56
G | 0.03 0.14 0.96 0.01 0.01 0.01 0.01 0.13 0.09 0.11 0.10
T | 0.82 0.01 0.01 0.07 0.91 0.02 0.84 0.02 0.48 0.42 0.15
Position count matrix (PCM)
A |   2  84   2  91   7   1   1  82  12  37  19
C |  13   1   1   1   1  96  14   3  30  10  56
G |   3  14  96   1   1   1   1  13   9  11  10
T |  82   1   1   7  91   2  84   2  48  42  15
Position weight matrix (PWM)
A | -2.77  0.97 -2.77  1.05 -1.52 -3.47 -3.47  0.94 -0.98  0.15 -0.52
C | -0.33 -2.89 -2.89 -2.89 -2.89  1.67 -0.25 -1.79  0.51 -0.59  1.13
G | -1.79 -0.25  1.67 -2.89 -2.89 -2.89 -2.89 -0.33 -0.69 -0.49 -0.59
T |  0.94 -3.47 -3.47 -1.52  1.05 -2.77  0.97 -2.77  0.41  0.27 -0.76
02 / COMPARATIVE BENCHMARKS
Alternative candidate matrices 2
Historical matrix candidates from the original ScerTF database. Expand a source to inspect its original logo, scores, and matrix values.
GAT4Badis et. al.P = No dataView matrix ↘
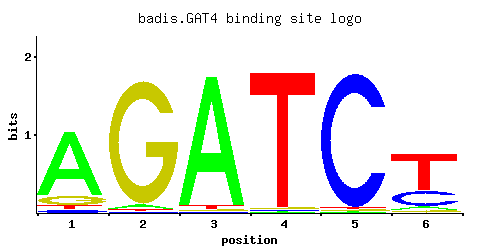
Fisher’s P-valueNo data
Information content8.465
Max PWM score7.16
Recommended cutoff5.37
Position frequency matrix (PFM)
A | 0.80 0.03 0.96 0.01 0.01 0.05
C | 0.04 0.01 0.01 0.01 0.97 0.28
G | 0.12 0.95 0.01 0.01 0.01 0.03
T | 0.04 0.01 0.02 0.97 0.01 0.64
Position count matrix (PCM)
A |  80   3  96   1   1   5
C |   4   1   1   1  97  28
G |  12  95   1   1   1   3
T |   4   1   2  97   1  64
Position weight matrix (PWM)
A |  0.92 -2.37  1.10 -3.47 -3.47 -1.86
C | -1.50 -2.89 -2.89 -2.89  1.68  0.44
G | -0.41  1.66 -2.89 -2.89 -2.89 -1.79
T | -2.08 -3.47 -2.77  1.11 -3.47  0.69
GAT4Zhao and StormoP = No dataView matrix ↘
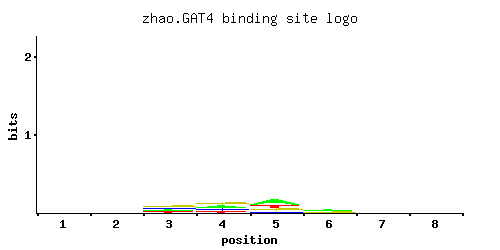
Fisher’s P-valueNo data
Information content0.7755
Max PWM score3.65
Recommended cutoff2.74
Position frequency matrix (PFM)
A | 0.185 0.261 0.230 0.297 0.437 0.320 0.245 0.251
C | 0.291 0.297 0.230 0.274 0.136 0.190 0.282 0.246
G | 0.263 0.187 0.347 0.312 0.213 0.265 0.205 0.227
T | 0.261 0.255 0.192 0.117 0.215 0.225 0.268 0.277
Position count matrix (PCM)
A |  18  26  23  29  43  32  24  25
C |  29  29  23  27  13  19  28  24
G |  26  18  34  31  21  26  20  22
T |  26  25  19  11  21  22  26  27
Position weight matrix (PWM)
A | -0.55 -0.20 -0.33 -0.07  0.31  0.00 -0.27 -0.24
C |  0.48  0.50  0.25  0.42 -0.28  0.05  0.45  0.31
G |  0.38  0.04  0.66  0.55  0.17  0.39  0.13  0.23
T | -0.20 -0.23 -0.51 -1.01 -0.40 -0.35 -0.18 -0.14
03 / EXPERIMENTAL CONTEXT
Gene-level annotations and interactions.
Genes bound in ChIP-chip experiments 1 genes
No Data
Genes affected by TF deletion 1 genes
No Data
Genes supported by both experiments 1 genes
No Data