ECM22
YLR228C
Sterol regulatory element binding protein, regulates transcription of sterol biosynthetic genes; contains Zn[2]-Cys[6] binuclear cluster; homologous to Upc2p; relocates from intracellular membranes to perinuclear foci on sterol depletion
Best-performing DNA-binding model.
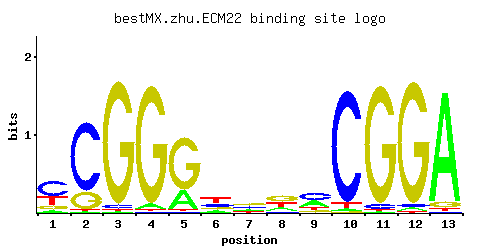
View and copy the recommended matrices ↘
A | 0.06 0.01 0.01 0.04 0.24 0.14 0.23 0.23 0.35 0.02 0.01 0.02 0.92
C | 0.53 0.78 0.03 0.01 0.02 0.26 0.30 0.08 0.42 0.93 0.04 0.02 0.01
G | 0.13 0.20 0.94 0.94 0.71 0.16 0.35 0.42 0.11 0.01 0.94 0.95 0.05
T | 0.29 0.01 0.01 0.01 0.02 0.44 0.13 0.27 0.12 0.04 0.01 0.01 0.02
A |   6   1   1   4  24  14  23  23  35   2   1   2  92
C |  53  78   3   1   2  26  30   8  42  93   4   2   1
G |  13  20  94  94  71  16  35  42  11   1  94  95   5
T |  28   1   1   1   2  44  13  27  12   4   1   1   2
A | -1.67 -3.47 -3.47 -2.08 -0.29 -0.83 -0.33 -0.33  0.09 -2.77 -3.47 -2.77  1.06
C |  1.08  1.47 -1.79 -2.89 -2.20  0.37  0.51 -0.81  0.85  1.64 -1.50 -2.20 -2.89
G | -0.33  0.11  1.65  1.65  1.37 -0.12  0.66  0.85 -0.49 -2.89  1.65  1.66 -1.28
T | -0.10 -3.47 -3.47 -3.47 -2.77  0.32 -0.90 -0.17 -0.98 -2.08 -3.47 -3.47 -2.77
Alternative candidate matrices 4
Historical matrix candidates from the original ScerTF database. Expand a source to inspect its original logo, scores, and matrix values.
ECM22Badis et. al.P = 0.02047View matrix ↘
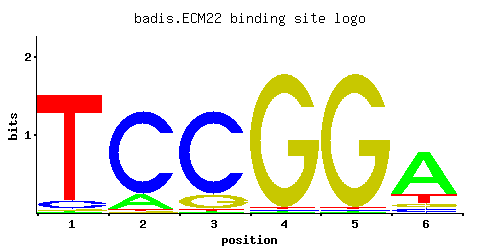
A | 0.14 0.01 0.01 0.01 0.01 0.91
C | 0.07 0.97 0.97 0.14 0.01 0.01
G | 0.07 0.01 0.01 0.84 0.84 0.07
T | 0.72 0.01 0.01 0.01 0.14 0.01
A |  14   1   1   1   1  91
C |   7  97  97  14   1   1
G |   7   1   1  84  84   7
T |  72   1   1   1  14   1
A | -0.83 -3.47 -3.47 -3.47 -3.47  1.05
C | -0.94  1.68  1.68 -0.25 -2.89 -2.89
G | -0.94 -2.89 -2.89  1.54  1.54 -0.94
T |  0.81 -3.47 -3.47 -3.47 -0.83 -3.47
ECM22Foat et. al.P = 0.8044View matrix ↘
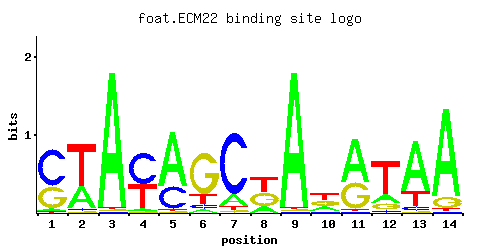
A | 0.02 0.21 0.67 0.01 0.39 0.01 0.42 0.04 0.15 0.01 0.40 0.01 0.64 0.01
C | 0.11 0.01 0.12 0.38 0.29 0.01 0.40 0.03 0.71 0.01 0.02 0.01 0.01 0.35
G | 0.01 0.06 0.05 0.01 0.06 0.01 0.01 0.79 0.07 0.29 0.55 0.01 0.03 0.60
T | 0.86 0.72 0.16 0.61 0.27 0.97 0.18 0.14 0.06 0.70 0.03 0.97 0.33 0.04
A |   2  21  67   1  39   1  42   4  15   1  40   1  64   1
C |  11   1  12  38  28   1  40   3  71   1   2   1   1  35
G |   1   6   5   1   6   1   1  79   7  28  55   1   3  60
T |  86  72  16  61  27  97  18  14   6  70   3  97  33   4
A | -2.77 -0.42  0.74 -3.47  0.20 -3.47  0.27 -2.08 -0.76 -3.47  0.22 -3.47  0.69 -3.47
C | -0.49 -2.89 -0.41  0.75  0.48 -2.89  0.80 -1.79  1.37 -2.89 -2.20 -2.89 -2.89  0.66
G | -2.89 -1.10 -1.28 -2.89 -1.10 -2.89 -2.89  1.48 -0.94  0.48  1.12 -2.89 -1.79  1.20
T |  0.99  0.81 -0.69  0.65 -0.17  1.11 -0.58 -0.83 -1.67  0.78 -2.37  1.11  0.03 -2.08
ECM22Macisaac et. alP = 1View matrix ↘
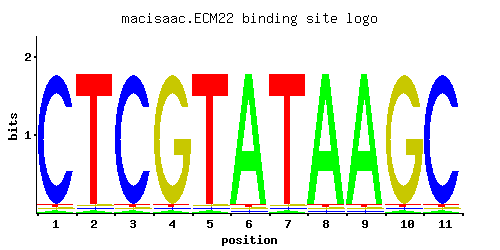
A | 0.012 0.012 0.012 0.012 0.012 0.964 0.012 0.964 0.964 0.012 0.012
C | 0.964 0.012 0.964 0.012 0.012 0.012 0.012 0.012 0.012 0.012 0.964
G | 0.012 0.012 0.012 0.964 0.012 0.012 0.012 0.012 0.012 0.964 0.012
T | 0.012 0.964 0.012 0.012 0.964 0.012 0.964 0.012 0.012 0.012 0.012
A |   1   1   1   1   1  96   1  96  96   1   1
C |  96   1  96   1   1   1   1   1   1   1  96
G |   1   1   1  96   1   1   1   1   1  96   1
T |   1  96   1   1  96   1  96   1   1   1   1
A | -3.28 -3.28 -3.28 -3.28 -3.28  1.10 -3.28  1.10  1.10 -3.28 -3.28
C |  1.68 -2.71  1.68 -2.71 -2.71 -2.71 -2.71 -2.71 -2.71 -2.71  1.68
G | -2.71 -2.71 -2.71  1.68 -2.71 -2.71 -2.71 -2.71 -2.71  1.68 -2.71
T | -3.28  1.10 -3.28 -3.28  1.10 -3.28  1.10 -3.28 -3.28 -3.28 -3.28
ECM22Zhao and StormoP = 0.005716View matrix ↘
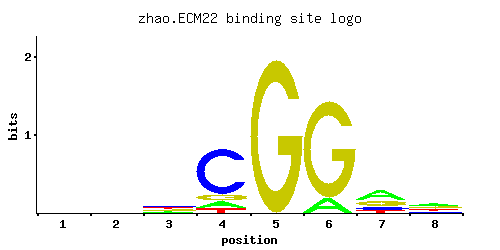
A | 0.181 0.089 0.001 0.001 0.062 0.289 0.292 0.241
C | 0.316 0.260 0.870 0.997 0.098 0.194 0.216 0.267
G | 0.174 0.166 0.001 0.001 0.741 0.326 0.262 0.251
T | 0.329 0.484 0.128 0.001 0.098 0.190 0.230 0.241
A |  18   8   0   0   6  28  29  24
C |  31  26  87  99   9  19  21  26
G |  17  16   0   0  74  32  26  25
T |  32  48  12   0   9  19  23  24
A | -0.57 -1.28 -5.77 -5.77 -1.64 -0.10 -0.09 -0.28
C |  0.56  0.37  1.58  1.71 -0.61  0.07  0.18  0.39
G | -0.03 -0.08 -5.19 -5.19  1.42  0.59  0.38  0.33
T |  0.03  0.41 -0.92 -5.77 -1.18 -0.52 -0.33 -0.28
Gene-level annotations and interactions.
Genes bound in ChIP-chip experiments 6 genes
YAL008W, YBR260C, YBR261C, YBR263W, YFR050C, YPL185W
Genes affected by TF deletion 69 genes
YDR432W, YDR188W, YLR056W, YIL111W, YKR038C, YNL017C, YGL012W, YDR098C, YIR030C, YNL143C, YMR314W, YLL059C, YMR072W, YLR100W, YOL053W, YJR101W, YEL023C, YKL055C, YLR101C, YMR227C, YOR072W, YPR148C, YLR164W, YIR037W, YBR296C, YJL222W, YIL096C, YLR228C, YMR030W, YFR048W, YNL094W, YPL063W, YMR272C, YMR146C, YMR119W-A, YOL153C, YER044C, YER100W, YLR165C, YMR325W, YER091C, YBR024W, YCR006C, YIL172C, YMR033W, YAR047C, YBR185C, YGL255W, YAL026C, YAL058C-A, YAR031W, YAL059W, YBR178W, YDL087C, YDR267C, YDR213W, YML014W, YDR182W, YGR085C, YHR046C, YHR107C, YMR154C, YNL203C, YOL132W, YBR151W, YBR089W, YDR121W, YGR024C, YGR267C