DAL80
YKR034W, UGA43
Negative regulator of genes in multiple nitrogen degradation pathways; expression is regulated by nitrogen levels and by Gln3p; member of the GATA-binding family, forms homodimers and heterodimers with Deh1p
Best-performing DNA-binding model.
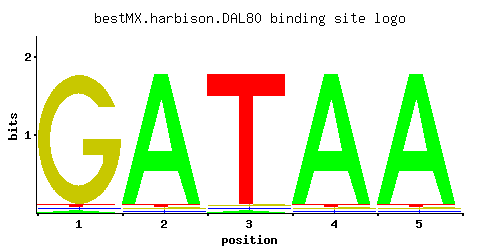
View and copy the recommended matrices ↘
A | 0.012 0.964 0.012 0.964 0.964
C | 0.012 0.012 0.012 0.012 0.012
G | 0.965 0.012 0.012 0.012 0.012
T | 0.012 0.012 0.964 0.012 0.012
A |   1  96   1  96  96
C |   1   1   1   1   1
G |  96   1   1   1   1
T |   1   1  96   1   1
A | -3.28  1.10 -3.28  1.10  1.10
C | -2.71 -2.71 -2.71 -2.71 -2.71
G |  1.68 -2.71 -2.71 -2.71 -2.71
T | -3.28 -3.28  1.10 -3.28 -3.28
Alternative candidate matrices 9
Historical matrix candidates from the original ScerTF database. Expand a source to inspect its original logo, scores, and matrix values.
DAL80Badis et. al.P = 0.01073View matrix ↘
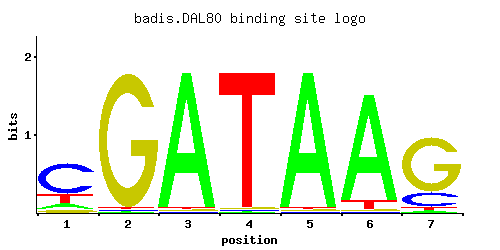
A | 0.11 0.01 0.97 0.01 0.97 0.91 0.03
C | 0.66 0.01 0.01 0.01 0.01 0.01 0.19
G | 0.06 0.97 0.01 0.01 0.01 0.01 0.75
T | 0.17 0.01 0.01 0.97 0.01 0.07 0.03
A |  11   1  97   1  97  91   3
C |  66   1   1   1   1   1  19
G |   6  97   1   1   1   1  75
T |  17   1   1  97   1   7   3
A | -1.07 -3.47  1.11 -3.47  1.11  1.05 -2.37
C |  1.30 -2.89 -2.89 -2.89 -2.89 -2.89  0.05
G | -1.10  1.68 -2.89 -2.89 -2.89 -2.89  1.43
T | -0.63 -3.47 -3.47  1.11 -3.47 -1.52 -2.37
DAL80_AFoat et. al.P = 1View matrix ↘
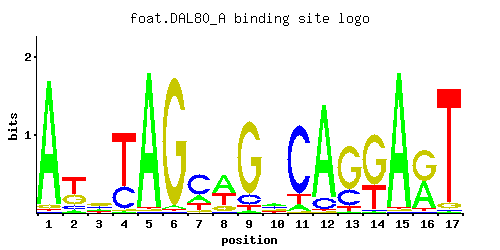
A | 0.95 0.05 0.18 0.01 0.97 0.02 0.20 0.51 0.02 0.34 0.07 0.87 0.01 0.01 0.97 0.44 0.01
C | 0.01 0.12 0.23 0.30 0.01 0.01 0.59 0.02 0.11 0.28 0.82 0.11 0.25 0.01 0.01 0.01 0.01
G | 0.03 0.32 0.42 0.01 0.01 0.97 0.05 0.16 0.82 0.25 0.01 0.01 0.68 0.68 0.01 0.52 0.05
T | 0.01 0.51 0.17 0.69 0.01 0.01 0.17 0.32 0.04 0.13 0.11 0.01 0.06 0.31 0.01 0.03 0.93
A |  95   5  18   1  97   2  20  51   2  34   7  87   1   1  97  44   1
C |   1  12  23  30   1   1  59   2  11  28  82  11  25   1   1   1   1
G |   3  32  42   1   1  97   5  16  82  25   1   1  68  68   1  52   5
T |   1  51  17  69   1   1  17  32   4  13  11   1   6  31   1   3  93
A |  1.09 -1.86 -0.58 -3.47  1.11 -2.77 -0.47  0.47 -2.77  0.06 -1.52  1.00 -3.47 -3.47  1.11  0.32 -3.47
C | -2.89 -0.41  0.25  0.51 -2.89 -2.89  1.19 -2.20 -0.49  0.44  1.52 -0.49  0.33 -2.89 -2.89 -2.89 -2.89
G | -1.79  0.58  0.85 -2.89 -2.89  1.68 -1.28 -0.12  1.52  0.33 -2.89 -2.89  1.33  1.33 -2.89  1.06 -1.28
T | -3.47  0.47 -0.63  0.77 -3.47 -3.47 -0.63  0.00 -2.08 -0.90 -1.07 -3.47 -1.67 -0.03 -3.47 -2.37  1.07
DAL80_BFoat et. al.P = 1View matrix ↘
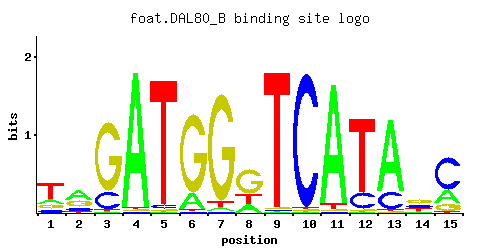
A | 0.01 0.23 0.01 0.80 0.04 0.01 0.97 0.21 0.04 0.01 0.95 0.01 0.01 0.07 0.56
C | 0.13 0.39 0.01 0.01 0.01 0.01 0.01 0.57 0.92 0.83 0.01 0.01 0.78 0.30 0.15
G | 0.63 0.28 0.19 0.18 0.01 0.97 0.01 0.01 0.01 0.01 0.03 0.01 0.20 0.18 0.11
T | 0.23 0.10 0.79 0.01 0.94 0.01 0.01 0.20 0.03 0.16 0.01 0.97 0.01 0.45 0.17
A |   1  23   1  80   4   1  97  21   4   1  95   1   1   7  56
C |  13  39   1   1   1   1   1  56  92  83   1   1  78  30  15
G |  63  28  19  18   1  97   1   1   1   1   3   1  20  18  11
T |  23  10  79   1  94   1   1  20   3  16   1  97   1  45  17
A | -3.47 -0.33 -3.47  0.92 -2.08 -3.47  1.11 -0.42 -2.08 -3.47  1.09 -3.47 -3.47 -1.52  0.56
C | -0.33  0.77 -2.89 -2.89 -2.89 -2.89 -2.89  1.15  1.63  1.53 -2.89 -2.89  1.47  0.51 -0.18
G |  1.25  0.44  0.05  0.00 -2.89  1.68 -2.89 -2.89 -2.89 -2.89 -1.79 -2.89  0.11  0.00 -0.49
T | -0.33 -1.16  0.90 -3.47  1.08 -3.47 -3.47 -0.47 -2.37 -0.69 -3.47  1.11 -3.47  0.34 -0.63
DAL80_AFordyce et. al.P = 0.171View matrix ↘
DAL80_BFordyce et. al.P = 0.0665View matrix ↘
DAL80_CFordyce et. al.P = 0.06557View matrix ↘
DAL80Macisaac et. alP = 0.03474View matrix ↘
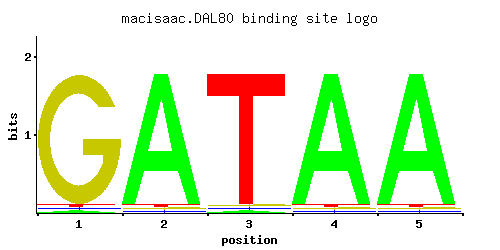
A | 0.012 0.964 0.012 0.964 0.964
C | 0.012 0.012 0.012 0.012 0.012
G | 0.964 0.012 0.012 0.012 0.012
T | 0.012 0.012 0.964 0.012 0.012
A |   1  96   1  96  96
C |   1   1   1   1   1
G |  96   1   1   1   1
T |   1   1  96   1   1
A | -3.28  1.10 -3.28  1.10  1.10
C | -2.71 -2.71 -2.71 -2.71 -2.71
G |  1.68 -2.71 -2.71 -2.71 -2.71
T | -3.28 -3.28  1.10 -3.28 -3.28
DAL80Morozov et. al.P = 0.008102View matrix ↘
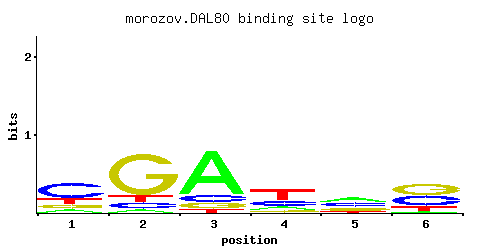
A | 0.110 0.050 0.725 0.145 0.350 0.050
C | 0.565 0.115 0.115 0.240 0.330 0.390
G | 0.145 0.720 0.110 0.110 0.240 0.420
T | 0.180 0.115 0.050 0.505 0.080 0.140
A |  11   5  72  14  35   5
C |  56  11  11  24  33  39
G |  14  72  11  11  24  42
T |  18  11   5  50   8  14
A | -1.07 -1.86  0.82 -0.79  0.09 -1.86
C |  1.14 -0.45 -0.45  0.29  0.61  0.77
G | -0.22  1.39 -0.49 -0.49  0.29  0.85
T | -0.58 -1.02 -1.86  0.46 -1.39 -0.83
DAL80Pachkov et alP = 0.02089View matrix ↘
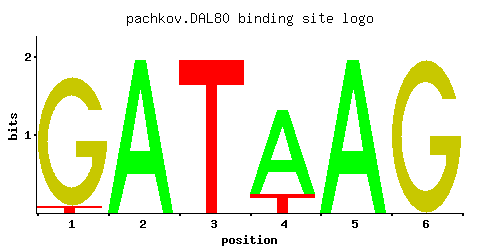
A | 0.001 0.001 0.178 1.000 0.001 0.042
C | 1.000 0.001 0.001 0.001 0.001 0.958
G | 0.001 0.001 0.001 0.001 0.001 0.001
T | 0.001 1.000 0.822 0.001 1.000 0.001
A |   0   0  17 100   0   4
C | 100   0   0   0   0  95
G |   0   0   0   0   0   0
T |   0 100  82   0 100   0
A | -5.77 -5.77 -0.59  1.14 -5.77 -2.03
C |  1.71 -5.19 -5.19 -5.19 -5.19  1.67
G | -5.19 -5.19 -5.19 -5.19 -5.19 -5.19
T | -5.77  1.14  0.94 -5.77  1.14 -5.77
Gene-level annotations and interactions.
Genes bound in ChIP-chip experiments 63 genes
YAL025C, YBL018C, YBL050W, YBL051C, YBR041W, YBR102C, YBR103W, YCR083W, YDL049C, YDL089W, YDL090C, YDL233W, YDL234C, YDR042C, YDR113C, YDR115W, YDR127W, YDR473C, YER085C, YER086W, YGR222W, YHL042W, YHR074W, YHR182W, YIL048W, YIL085C, YIL086C, YIL087C, YIL150C, YJL157C, YJL205C-A, YJR051W, YKL070W, YKR017C, YLL011W, YLR172C, YLR173W, YLR242C, YLR243W, YLR272C, YLR273C, YLR274W, YLR363C, YLR364W, YMR178W, YNL131W, YNL188W, YNL256W, YNL257C, YNL258C, YOL023W, YOL042W, YOL043C, YOL055C, YOR093C, YOR094W, YOR151C, YOR174W, YOR209C, YOR210W, YOR280C, YOR282W, YPL020C
Genes affected by TF deletion 35 genes
YDR398W, YHR146W, YPL016W, YOL110W, YBR093C, YDR281C, YGL072C, YLR183C, YMR023C, YBR166C, YLR099C, YHR031C, YLR316C, YHR215W, YLR312C, YAR071W, YIL059C, YCR024C-A, YMR026C, YNL099C, YOR209C, YOR017W, YPL001W, YPL066W, YOR333C, YDR322W, YNL318C, YHR136C, YBR182C, YHR135C, YJL142C, YCR099C, YJL047C, YJR013W, YOR124C
Genes supported by both experiments 1 genes
YOR209C
Predicted TF–TF partners 3 genes
GAT1, GLN3, GZF3