CRZ1
YNL027W, TCN1, HAL8
Transcription factor that activates transcription of genes involved in stress response; nuclear localization is positively regulated by calcineurin-mediated dephosphorylation
Best-performing DNA-binding model.
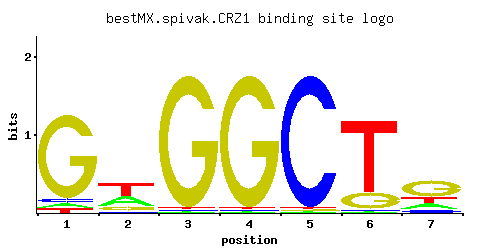
View and copy the recommended matrices ↘
A | 0.046 0.349 0.011 0.011 0.011 0.011 0.166
C | 0.046 0.041 0.011 0.011 0.967 0.011 0.096
G | 0.867 0.156 0.967 0.967 0.011 0.186 0.572
T | 0.041 0.454 0.011 0.011 0.011 0.792 0.166
A |   4  34   1   1   1   1  16
C |   4   4   1   1  96   1   9
G |  86  15  96  96   1  18  57
T |   4  45   1   1   1  79  16
A | -1.94  0.09 -3.37 -3.37 -3.37 -3.37 -0.66
C | -1.36 -1.48 -2.80 -2.80  1.68 -2.80 -0.63
G |  1.57 -0.14  1.68  1.68 -2.80  0.03  1.16
T | -2.05  0.35 -3.37 -3.37 -3.37  0.91 -0.66
Alternative candidate matrices 3
Historical matrix candidates from the original ScerTF database. Expand a source to inspect its original logo, scores, and matrix values.
CRZ1Badis et. al.P = 1.51e-07View matrix ↘
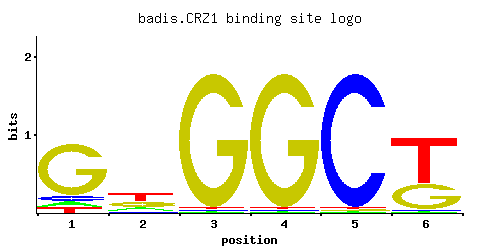
A | 0.62 0.01 0.01 0.01 0.42 0.07
C | 0.36 0.01 0.97 0.97 0.30 0.77
G | 0.01 0.97 0.01 0.01 0.07 0.08
T | 0.01 0.01 0.01 0.01 0.21 0.08
A |  62   1   1   1  42   7
C |  36   1  97  97  30  77
G |   1  97   1   1   7   8
T |   1   1   1   1  21   8
A |  0.66 -3.47 -3.47 -3.47  0.27 -1.52
C |  0.69 -2.89  1.68  1.68  0.51  1.45
G | -2.89  1.68 -2.89 -2.89 -0.94 -0.81
T | -3.47 -3.47 -3.47 -3.47 -0.42 -1.39
CRZ1Foat et. al.P = 0.3279View matrix ↘
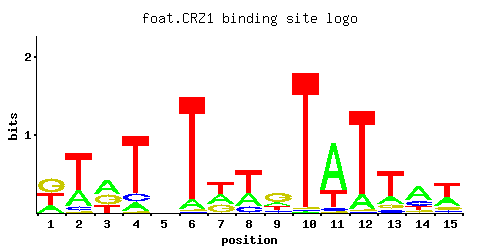
A | 0.49 0.14 0.63 0.84 0.25 0.97 0.17 0.55 0.38 0.90 0.27 0.77 0.23 0.65 0.34
C | 0.11 0.10 0.10 0.01 0.01 0.01 0.51 0.01 0.28 0.01 0.29 0.01 0.34 0.01 0.44
G | 0.08 0.22 0.09 0.01 0.05 0.01 0.13 0.16 0.01 0.01 0.18 0.11 0.01 0.08 0.01
T | 0.31 0.53 0.18 0.14 0.69 0.01 0.20 0.29 0.34 0.08 0.26 0.11 0.43 0.27 0.22
A |  49  14  63  84  25  97  17  55  38  90  27  77  23  65  34
C |  11  10  10   1   1   1  51   1  28   1  28   1  34   1  44
G |   8  22   9   1   5   1  13  16   1   1  18  11   1   8   1
T |  31  53  18  14  69   1  20  28  34   8  26  11  43  27  22
A |  0.43 -0.83  0.68  0.97 -0.25  1.11 -0.63  0.54  0.17  1.03 -0.17  0.88 -0.33  0.71  0.06
C | -0.49 -0.59 -0.59 -2.89 -2.89 -2.89  1.04 -2.89  0.44 -2.89  0.48 -2.89  0.64 -2.89  0.89
G | -0.81  0.20 -0.69 -2.89 -1.28 -2.89 -0.33 -0.12 -2.89 -2.89  0.00 -0.49 -2.89 -0.81 -2.89
T | -0.03  0.50 -0.58 -0.83  0.77 -3.47 -0.47 -0.10  0.06 -1.39 -0.21 -1.07  0.30 -0.17 -0.37
CRZ1Macisaac et. alP = 2.32e-05View matrix ↘
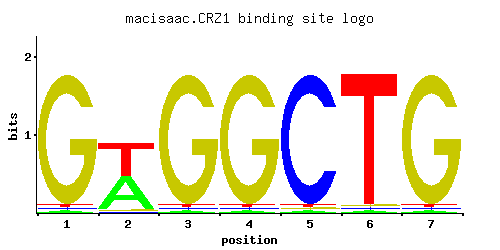
A | 0.012 0.488 0.012 0.012 0.012 0.012 0.012
C | 0.012 0.012 0.012 0.012 0.964 0.012 0.012
G | 0.964 0.012 0.964 0.964 0.012 0.012 0.964
T | 0.012 0.488 0.012 0.012 0.012 0.964 0.012
A |   1  48   1   1   1   1   1
C |   1   1   1   1  96   1   1
G |  96   1  96  96   1   1  96
T |   1  48   1   1   1  96   1
A | -3.28  0.42 -3.28 -3.28 -3.28 -3.28 -3.28
C | -2.71 -2.71 -2.71 -2.71  1.68 -2.71 -2.71
G |  1.68 -2.71  1.68  1.68 -2.71 -2.71  1.68
T | -3.28  0.42 -3.28 -3.28 -3.28  1.10 -3.28
Gene-level annotations and interactions.
Genes bound in ChIP-chip experiments 1 genes
No Data
Genes affected by TF deletion 67 genes
YMR016C, YJL053W, YBR005W, YGL166W, YMR009W, YOL014W, YOL016C, YOR220W, YPL016W, YHR053C, YHR055C, YBR287W, YLR120C, YMR314W, YMR316C-A, YMR316W, YBR093C, YBR129C, YDL002C, YER029C, YLR257W, YNL030W, YGL053W, YOR385W, YPL057C, YGL174W, YIL117C, YNL027W, YNL029C, YGR161C, YKL055C, YLR099C, YLR350W, YBL003C, YLR194C, YMR294W-A, YPL156C, YBR071W, YBR101C, YDL012C, YOR298C-A, YBR296C, YER035W, YML094W, YOR209C, YDR210W, YGR136W, YLR414C, YLR231C, YLR294C, YOL032W, YDR209C, YEL060C, YGR137W, YNL290W, YOR052C, YBR082C, YKL001C, YLL012W, YDL241W, YAL033W, YBR244W, YDR213W, YDR486C, YDL212W, YGR268C, YDR151C
Predicted TF–TF partners 2 genes
STP1, SUT1