CHA4
YLR098C, SIL3, SIL2
DNA binding transcriptional activator, mediates serine/threonine activation of the catabolic L-serine (L-threonine) deaminase (CHA1); Zinc-finger protein with Zn[2]-Cys[6] fungal-type binuclear cluster domain
Best-performing DNA-binding model.
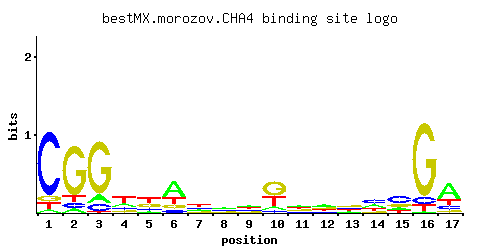
View and copy the recommended matrices ↘
A | 0.041 0.068 0.117 0.218 0.109 0.559 0.194 0.304 0.363 0.121 0.348 0.314 0.155 0.293 0.158 0.017 0.561
C | 0.809 0.074 0.102 0.176 0.169 0.097 0.305 0.286 0.205 0.055 0.192 0.138 0.255 0.391 0.483 0.083 0.166
G | 0.079 0.759 0.759 0.148 0.311 0.134 0.165 0.240 0.191 0.494 0.227 0.306 0.339 0.125 0.219 0.833 0.084
T | 0.072 0.099 0.021 0.458 0.412 0.210 0.336 0.170 0.241 0.329 0.232 0.242 0.251 0.192 0.140 0.067 0.189
A |   4   6  11  21  10  55  19  30  36  12  34  31  15  29  15   1  56
C |  80   7  10  17  16   9  30  28  20   5  19  13  25  39  48   8  16
G |   7  75  75  14  31  13  16  24  19  49  22  30  33  12  21  83   8
T |   7   9   2  45  41  21  33  17  24  32  23  24  25  19  14   6  18
A | -2.05 -1.55 -1.01 -0.38 -1.08  0.56 -0.50 -0.05  0.13 -0.97  0.08 -0.02 -0.72 -0.09 -0.71 -2.94  0.56
C |  1.50 -0.89 -0.57 -0.02 -0.06 -0.62  0.53  0.46  0.13 -1.19  0.06 -0.27  0.35  0.78  0.99 -0.77 -0.08
G | -0.82  1.44  1.44 -0.20  0.55 -0.30 -0.09  0.29  0.06  1.01  0.23  0.53  0.63 -0.36  0.20  1.53 -0.76
T | -1.49 -1.17 -2.72  0.36  0.25 -0.42  0.05 -0.63 -0.28  0.03 -0.32 -0.28 -0.24 -0.51 -0.83 -1.56 -0.53
Alternative candidate matrices 6
Historical matrix candidates from the original ScerTF database. Expand a source to inspect its original logo, scores, and matrix values.
CHA4Badis et. al.P = 1View matrix ↘
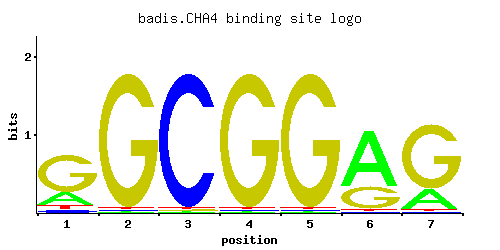
A | 0.22 0.01 0.01 0.01 0.01 0.70 0.22
C | 0.05 0.01 0.97 0.01 0.01 0.01 0.01
G | 0.68 0.97 0.01 0.97 0.97 0.28 0.76
T | 0.05 0.01 0.01 0.01 0.01 0.01 0.01
A |  22   1   1   1   1  70  22
C |   5   1  97   1   1   1   1
G |  68  97   1  97  97  28  76
T |   5   1   1   1   1   1   1
A | -0.37 -3.47 -3.47 -3.47 -3.47  0.78 -0.37
C | -1.28 -2.89  1.68 -2.89 -2.89 -2.89 -2.89
G |  1.33  1.68 -2.89  1.68  1.68  0.44  1.44
T | -1.86 -3.47 -3.47 -3.47 -3.47 -3.47 -3.47
CHA4_AFoat et. al.P = 0.0003646View matrix ↘
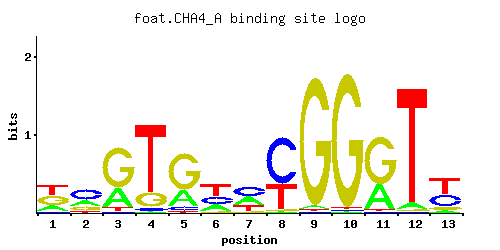
A | 0.48 0.93 0.01 0.01 0.01 0.34 0.23 0.44 0.01 0.78 0.05 0.07 0.38
C | 0.11 0.01 0.65 0.97 0.96 0.01 0.03 0.03 0.64 0.17 0.65 0.21 0.37
G | 0.37 0.01 0.01 0.01 0.01 0.64 0.39 0.27 0.08 0.03 0.01 0.49 0.03
T | 0.05 0.05 0.34 0.01 0.02 0.01 0.34 0.26 0.27 0.01 0.29 0.22 0.22
A |  48  93   1   1   1  34  23  44   1  78   5   7  38
C |  11   1  65  97  96   1   3   3  64  17  65  21  37
G |  37   1   1   1   1  64  39  27   8   3   1  49   3
T |   5   5  34   1   2   1  34  26  27   1  28  22  22
A |  0.41  1.07 -3.47 -3.47 -3.47  0.06 -0.33  0.32 -3.47  0.89 -1.86 -1.52  0.17
C | -0.49 -2.89  1.28  1.68  1.67 -2.89 -1.79 -1.79  1.27 -0.06  1.28  0.15  0.72
G |  0.72 -2.89 -2.89 -2.89 -2.89  1.27  0.77  0.41 -0.81 -1.79 -2.89  1.00 -1.79
T | -1.86 -1.86  0.06 -3.47 -2.77 -3.47  0.06 -0.21 -0.17 -3.47 -0.10 -0.37 -0.37
CHA4_BFoat et. al.P = 0.0005895View matrix ↘
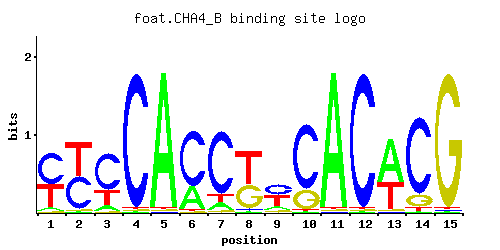
A | 0.05 0.01 0.09 0.01 0.97 0.28 0.09 0.01 0.12 0.01 0.97 0.01 0.60 0.01 0.01
C | 0.55 0.49 0.65 0.97 0.01 0.71 0.80 0.04 0.41 0.76 0.01 0.97 0.01 0.84 0.01
G | 0.01 0.01 0.01 0.01 0.01 0.01 0.02 0.41 0.07 0.22 0.01 0.01 0.01 0.13 0.97
T | 0.39 0.50 0.26 0.01 0.01 0.01 0.09 0.55 0.40 0.01 0.01 0.01 0.38 0.03 0.01
A |   5   1   9   1  97  28   9   1  12   1  97   1  60   1   1
C |  55  49  65  97   1  71  80   4  41  76   1  97   1  84   1
G |   1   1   1   1   1   1   2  41   7  22   1   1   1  13  97
T |  39  50  26   1   1   1   9  55  40   1   1   1  38   3   1
A | -1.86 -3.47 -1.27 -3.47  1.11 -0.13 -1.27 -3.47 -0.98 -3.47  1.11 -3.47  0.63 -3.47 -3.47
C |  1.12  1.00  1.28  1.68 -2.89  1.37  1.49 -1.50  0.82  1.44 -2.89  1.68 -2.89  1.54 -2.89
G | -2.89 -2.89 -2.89 -2.89 -2.89 -2.89 -2.20  0.82 -0.94  0.20 -2.89 -2.89 -2.89 -0.33  1.68
T |  0.20  0.45 -0.21 -3.47 -3.47 -3.47 -1.27  0.54  0.22 -3.47 -3.47 -3.47  0.17 -2.37 -3.47
CHA4Macisaac et. alP = 0.001232View matrix ↘
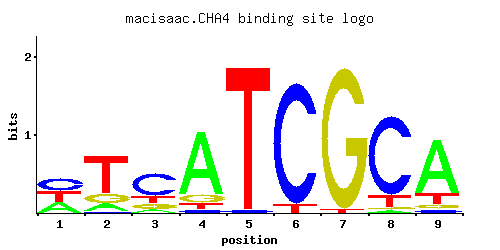
A | 0.140 0.120 0.020 0.060 0.978 0.060 0.160 0.680 0.320
C | 0.060 0.020 0.978 0.001 0.001 0.100 0.140 0.160 0.001
G | 0.040 0.840 0.001 0.938 0.020 0.040 0.620 0.020 0.380
T | 0.760 0.020 0.001 0.001 0.001 0.800 0.080 0.140 0.300
A |  14  12   2   6  97   6  16  68  32
C |   6   2  97   0   0  10  14  16   0
G |   4  84   0  93   2   4  62   2  38
T |  76   2   0   0   0  80   8  14  30
A | -0.83 -0.98 -2.77 -1.67  1.12 -1.67 -0.69  0.75  0.00
C | -1.10 -2.20  1.69 -5.19 -5.19 -0.59 -0.25 -0.12 -5.19
G | -1.50  1.54 -5.19  1.65 -2.20 -1.50  1.24 -2.20  0.75
T |  0.86 -2.77 -5.77 -5.77 -5.77  0.92 -1.39 -0.83 -0.06
CHA4Zhu et. al.P = 1View matrix ↘
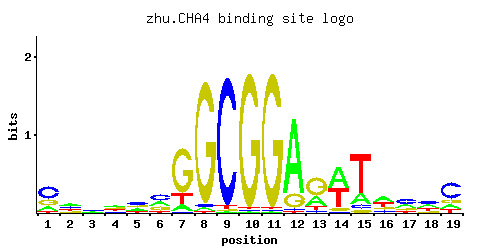
A | 0.11 0.19 0.13 0.31 0.70 0.42 0.10 0.01 0.01 0.01 0.02 0.01 0.16 0.06 0.11 0.28 0.19 0.22 0.06
C | 0.16 0.12 0.20 0.14 0.05 0.07 0.56 0.16 0.97 0.97 0.01 0.95 0.72 0.27 0.32 0.29 0.22 0.14 0.25
G | 0.58 0.35 0.43 0.14 0.07 0.03 0.07 0.02 0.01 0.01 0.96 0.02 0.02 0.40 0.33 0.13 0.30 0.29 0.50
T | 0.16 0.34 0.24 0.41 0.19 0.48 0.28 0.81 0.01 0.01 0.01 0.02 0.10 0.28 0.25 0.30 0.29 0.34 0.19
A |  11  19  13  31  70  42  10   1   1   1   2   1  16   6  11  28  19  22   6
C |  16  12  20  14   5   7  56  16  97  97   1  95  72  27  32  28  22  14  25
G |  57  35  43  14   7   3   7   2   1   1  96   2   2  40  33  13  30  28  50
T |  16  34  24  41  19  48  28  81   1   1   1   2  10  28  25  30  28  34  19
A | -1.07 -0.52 -0.90 -0.03  0.78  0.27 -1.16 -3.47 -3.47 -3.47 -2.77 -3.47 -0.69 -1.67 -1.07 -0.13 -0.52 -0.37 -1.67
C | -0.12 -0.41  0.11 -0.25 -1.28 -0.94  1.13 -0.12  1.68  1.68 -2.89  1.66  1.39  0.41  0.58  0.48  0.20 -0.25  0.33
G |  1.17  0.66  0.87 -0.25 -0.94 -1.79 -0.94 -2.20 -2.89 -2.89  1.67 -2.20 -2.20  0.80  0.61 -0.33  0.51  0.48  1.02
T | -0.69  0.06 -0.29  0.25 -0.52  0.41 -0.13  0.93 -3.47 -3.47 -3.47 -2.77 -1.16 -0.13 -0.25 -0.06 -0.10  0.06 -0.52
CHA4Zhao and StormoP = 0.8536View matrix ↘
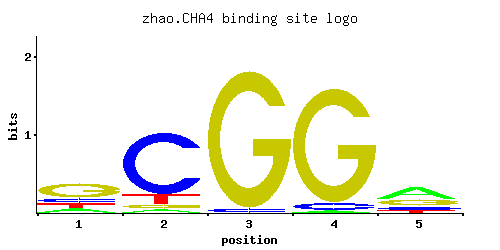
A | 0.140 0.035 0.001 0.016 0.492
C | 0.150 0.797 0.027 0.055 0.130
G | 0.567 0.049 0.971 0.927 0.287
T | 0.143 0.119 0.001 0.001 0.091
A |  14   3   0   1  49
C |  15  79   2   5  13
G |  56   4  97  92  28
T |  14  11   0   0   9
A | -0.83 -2.21 -5.77 -3.00  0.43
C | -0.18  1.49 -1.90 -1.19 -0.33
G |  1.15 -1.30  1.69  1.64  0.47
T | -0.81 -0.99 -5.77 -5.77 -1.26
Gene-level annotations and interactions.
Genes bound in ChIP-chip experiments 80 genes
YBL025W, YBR245C, YBR251W, YBR272C, YCL038C, YCL063W, YCL064C, YCL065W, YCL066W, YCL067C, YCR039C, YCR040W, YCR041W, YDL034W, YDL036C, YDL054C, YDR056C, YDR057W, YDR076W, YDR149C, YDR177W, YDR304C, YDR322W, YDR355C, YDR523C, YER007C-A, YER044C, YER082C, YER084W, YER085C, YER086W, YER181C, YGL002W, YGL003C, YGL121C, YGL227W, YGR066C, YGR100W, YHR065C, YHR066W, YHR091C, YHR186C, YHR187W, YIL097W, YIL098C, YIL139C, YJL148W, YJL205C-A, YJR012C, YJR013W, YJR014W, YKL077W, YKL129C, YKR026C, YLR053C, YLR367W, YLR395C, YLR415C, YLR416C, YLR417W, YMR065W, YMR135W-A, YMR187C, YNL123W, YNL296W, YOL033W, YOL102C, YOR093C, YOR094W, YOR154W, YOR209C, YOR210W, YOR280C, YOR282W, YOR318C, YOR319W, YPL194W, YPR139C, YPR140W, YPR172W
Genes affected by TF deletion 41 genes
YOR225W, YGR097W, YOR226C, YMR189W, YPL016W, YPR138C, YER081W, YGR211W, YIL051C, YLR441C, YOR043W, YCL063W, YCL064C, YLR099C, YPL273W, YCL025C, YDL201W, YDR344C, YKL177W, YMR321C, YPL119C, YLR258W, YAR018C, YKL120W, YKL001C, YLR355C, YNL160W, YPR035W, YER100W, YBL108W, YAL060W, YGL255W, YMR034C, YHR137W, YLR111W, YLR049C, YFL034C-A, YGR085C, YLR362W, YDL218W, YFL034C-B
Genes supported by both experiments 2 genes
YCL063W, YCL064C