CAD1
YDR423C, YAP2
AP-1-like basic leucine zipper (bZIP) transcriptional activator involved in stress responses, iron metabolism, and pleiotropic drug resistance; controls a set of genes involved in stabilizing proteins; binds consensus sequence TTACTAA
Best-performing DNA-binding model.
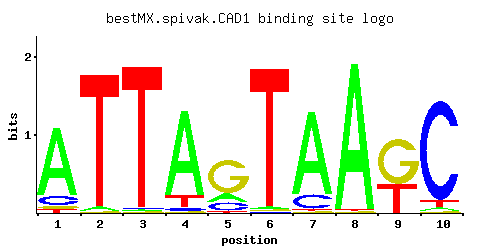
View and copy the recommended matrices ↘
A | 0.811 0.026 0.007 0.850 0.159 0.016 0.834 0.986 0.004 0.030
C | 0.116 0.002 0.008 0.027 0.155 0.004 0.147 0.002 0.006 0.901
G | 0.042 0.009 0.005 0.006 0.664 0.006 0.006 0.005 0.607 0.011
T | 0.032 0.963 0.979 0.116 0.022 0.974 0.012 0.007 0.383 0.057
A |  81   2   0  85  15   1  83  98   0   3
C |  11   0   0   2  15   0  14   0   0  90
G |   4   0   0   0  66   0   0   0  60   1
T |   3  96  97  11   2  97   1   0  38   5
A |  0.93 -2.51 -3.82  0.98 -0.70 -3.00  0.96  1.13 -4.38 -2.37
C | -0.44 -4.50 -3.11 -1.90 -0.15 -3.81 -0.20 -4.50 -3.40  1.61
G | -1.46 -3.00 -3.58 -3.40  1.31 -3.40 -3.40 -3.58  1.22 -2.80
T | -2.30  1.10  1.12 -1.01 -2.68  1.11 -3.28 -3.82  0.18 -1.73
Alternative candidate matrices 10
Historical matrix candidates from the original ScerTF database. Expand a source to inspect its original logo, scores, and matrix values.
CAD1_AFoat et. al.P = 1View matrix ↘
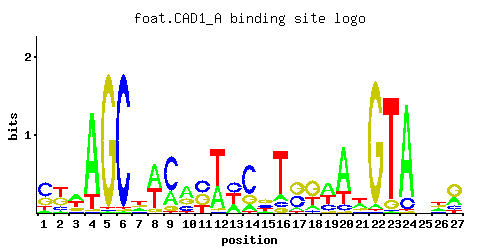
A | 0.07 0.05 0.40 0.83 0.01 0.01 0.24 0.50 0.25 0.47 0.01 0.35 0.28 0.13 0.14 0.10 0.12 0.15 0.42 0.70 0.34 0.03 0.01 0.87 0.28 0.29 0.28
C | 0.52 0.18 0.08 0.01 0.01 0.97 0.13 0.01 0.63 0.22 0.39 0.01 0.37 0.64 0.30 0.09 0.37 0.06 0.24 0.09 0.11 0.01 0.01 0.11 0.21 0.11 0.15
G | 0.29 0.38 0.19 0.01 0.97 0.01 0.25 0.09 0.10 0.25 0.38 0.04 0.01 0.21 0.40 0.08 0.46 0.55 0.02 0.01 0.18 0.95 0.08 0.01 0.27 0.30 0.51
T | 0.13 0.40 0.33 0.15 0.01 0.01 0.38 0.41 0.01 0.05 0.23 0.60 0.35 0.03 0.16 0.73 0.05 0.24 0.32 0.20 0.36 0.01 0.89 0.01 0.24 0.30 0.06
A |   7   5  40  83   1   1  24  50  25  47   1  35  28  13  14  10  12  15  42  70  34   3   1  87  28  28  28
C |  52  18   8   1   1  97  13   1  63  22  39   1  37  64  30   9  37   6  24   9  11   1   1  11  21  11  15
G |  28  38  19   1  97   1  25   9  10  25  38   4   1  21  40   8  46  55   2   1  18  95   8   1  27  30  51
T |  13  40  33  15   1   1  38  41   1   5  23  60  35   3  16  73   5  24  32  20  36   1  89   1  24  30   6
A | -1.52 -1.86  0.22  0.95 -3.47 -3.47 -0.29  0.45 -0.25  0.38 -3.47  0.09 -0.13 -0.90 -0.83 -1.16 -0.98 -0.76  0.27  0.78  0.06 -2.37 -3.47  1.00 -0.13 -0.10 -0.13
C |  1.06  0.00 -0.81 -2.89 -2.89  1.68 -0.33 -2.89  1.25  0.20  0.77 -2.89  0.72  1.27  0.51 -0.69  0.72 -1.10  0.29 -0.69 -0.49 -2.89 -2.89 -0.49  0.15 -0.49 -0.18
G |  0.48  0.75  0.05 -2.89  1.68 -2.89  0.33 -0.69 -0.59  0.33  0.75 -1.50 -2.89  0.15  0.80 -0.81  0.94  1.12 -2.20 -2.89  0.00  1.66 -0.81 -2.89  0.41  0.51  1.04
T | -0.90  0.22  0.03 -0.76 -3.47 -3.47  0.17  0.25 -3.47 -1.86 -0.33  0.63  0.09 -2.37 -0.69  0.82 -1.86 -0.29  0.00 -0.47  0.12 -3.47  1.02 -3.47 -0.29 -0.06 -1.67
CAD1_BFoat et. al.P = 4.38e-05View matrix ↘
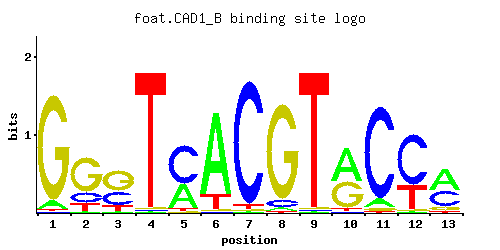
A | 0.03 0.31 0.01 0.03 0.97 0.01 0.03 0.15 0.03 0.97 0.12 0.13 0.01
C | 0.09 0.01 0.03 0.44 0.01 0.89 0.01 0.01 0.01 0.01 0.52 0.66 0.91
G | 0.37 0.68 0.88 0.01 0.01 0.07 0.95 0.01 0.60 0.01 0.34 0.19 0.01
T | 0.50 0.01 0.08 0.53 0.01 0.03 0.01 0.83 0.36 0.01 0.02 0.02 0.07
A |   3  31   1   3  97   1   3  15   3  97  12  13   1
C |   9   1   3  44   1  89   1   1   1   1  52  66  91
G |  37  68  88   1   1   7  95   1  60   1  34  19   1
T |  50   1   8  53   1   3   1  83  36   1   2   2   7
A | -2.37 -0.03 -3.47 -2.37  1.11 -3.47 -2.37 -0.76 -2.37  1.11 -0.98 -0.90 -3.47
C | -0.69 -2.89 -1.79  0.89 -2.89  1.60 -2.89 -2.89 -2.89 -2.89  1.06  1.30  1.62
G |  0.72  1.33  1.59 -2.89 -2.89 -0.94  1.66 -2.89  1.20 -2.89  0.64  0.05 -2.89
T |  0.45 -3.47 -1.39  0.50 -3.47 -2.37 -3.47  0.95  0.12 -3.47 -2.77 -2.77 -1.52
CAD1_CFoat et. al.P = 0.0001573View matrix ↘
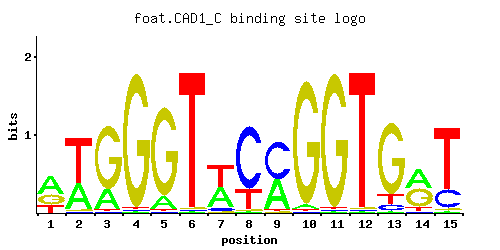
A | 0.75 0.08 0.10 0.97 0.01 0.01 0.01 0.23 0.48 0.97 0.01 0.01 0.01 0.62 0.21
C | 0.02 0.44 0.83 0.01 0.97 0.95 0.01 0.01 0.02 0.01 0.86 0.97 0.76 0.01 0.29
G | 0.22 0.03 0.07 0.01 0.01 0.01 0.55 0.75 0.08 0.01 0.01 0.01 0.01 0.01 0.01
T | 0.01 0.45 0.01 0.01 0.01 0.03 0.44 0.01 0.43 0.01 0.12 0.01 0.23 0.36 0.50
A |  75   8  10  97   1   1   1  23  48  97   1   1   1  62  21
C |   2  44  83   1  97  95   1   1   2   1  86  97  76   1  28
G |  22   3   7   1   1   1  55  75   8   1   1   1   1   1   1
T |   1  45   1   1   1   3  44   1  43   1  12   1  23  36  50
A |  0.85 -1.39 -1.16  1.11 -3.47 -3.47 -3.47 -0.33  0.41  1.11 -3.47 -3.47 -3.47  0.66 -0.42
C | -2.20  0.89  1.53 -2.89  1.68  1.66 -2.89 -2.89 -2.20 -2.89  1.56  1.68  1.44 -2.89  0.48
G |  0.20 -1.79 -0.94 -2.89 -2.89 -2.89  1.12  1.43 -0.81 -2.89 -2.89 -2.89 -2.89 -2.89 -2.89
T | -3.47  0.34 -3.47 -3.47 -3.47 -2.37  0.32 -3.47  0.30 -3.47 -0.98 -3.47 -0.33  0.12  0.45
CAD1_AFordyce et. al.P = 0.3325View matrix ↘
CAD1_BFordyce et. al.P = 0.8523View matrix ↘
CAD1_CFordyce et. al.P = 1View matrix ↘
CAD1Harbison et. al.P = 1.70e-26View matrix ↘
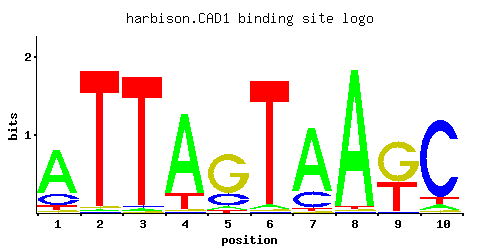
A | 0.710 0.008 0.014 0.826 0.054 0.031 0.765 0.974 0.007 0.060
C | 0.188 0.004 0.016 0.009 0.218 0.007 0.199 0.004 0.011 0.847
G | 0.040 0.017 0.009 0.012 0.686 0.011 0.012 0.009 0.576 0.022
T | 0.062 0.971 0.962 0.153 0.042 0.952 0.024 0.013 0.407 0.071
A |  71   0   1  82   5   3  76  97   0   6
C |  18   0   1   0  21   0  19   0   1  84
G |   4   1   0   1  68   1   1   0  57   2
T |   6  97  96  15   4  95   2   1  40   7
A |  0.80 -3.69 -3.13  0.95 -1.78 -2.33  0.87  1.11 -3.82 -1.67
C |  0.04 -3.81 -2.42 -3.00  0.19 -3.25  0.10 -3.81 -2.80  1.55
G | -1.50 -2.36 -3.00 -2.71  1.34 -2.80 -2.71 -3.00  1.16 -2.10
T | -1.64  1.11  1.10 -0.74 -2.03  1.09 -2.59 -3.20  0.24 -1.51
CAD1Macisaac et. alP = 3.62e-26View matrix ↘
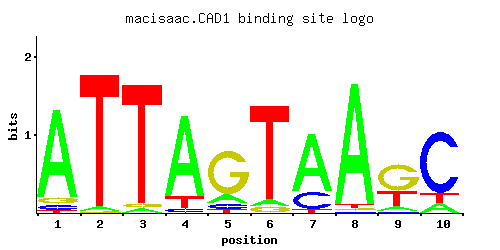
A | 0.113 0.303 0.027 0.044 0.881 0.053 0.113 0.939 0.963 0.018
C | 0.001 0.584 0.018 0.001 0.056 0.730 0.001 0.030 0.009 0.060
G | 0.777 0.027 0.009 0.223 0.001 0.078 0.047 0.001 0.001 0.049
T | 0.109 0.086 0.946 0.732 0.062 0.139 0.839 0.030 0.027 0.873
A |  11  30   2   4  88   5  11  93  96   1
C |   0  58   1   0   5  73   0   3   0   6
G |  77   2   0  22   0   7   4   0   0   4
T |  10   8  94  73   6  13  83   3   2  87
A | -1.04 -0.05 -2.47 -1.98  1.01 -1.80 -1.04  1.08  1.10 -2.88
C | -5.19  1.18 -2.30 -5.19 -1.17  1.40 -5.19 -1.79 -3.00 -1.10
G |  1.46 -1.90 -3.00  0.21 -5.19 -0.84 -1.34 -5.19 -5.19 -1.30
T | -1.08 -1.31  1.08  0.83 -1.64 -0.83  0.96 -2.37 -2.47  1.00
CAD1Morozov et. al.P = 2.72e-26View matrix ↘
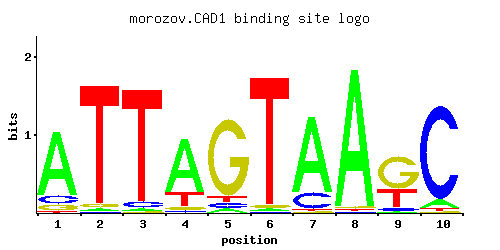
A | 0.022 0.321 0.009 0.010 0.955 0.055 0.186 0.923 0.941 0.017
C | 0.013 0.601 0.014 0.009 0.023 0.849 0.042 0.006 0.036 0.080
G | 0.884 0.064 0.004 0.177 0.009 0.051 0.027 0.054 0.010 0.106
T | 0.081 0.014 0.973 0.805 0.012 0.045 0.744 0.016 0.014 0.797
A |   2  32   0   1  95   5  18  92  94   1
C |   1  60   1   0   2  84   4   0   3   8
G |  88   6   0  17   0   5   2   5   1  10
T |   8   1  97  80   1   4  74   1   1  79
A | -2.68  0.00 -3.57 -3.47  1.09 -1.76 -0.54  1.06  1.08 -2.94
C | -2.63  1.21 -2.55 -3.00 -2.06  1.55 -1.46 -3.40 -1.61 -0.81
G |  1.59 -1.03 -3.81 -0.02 -3.00 -1.26 -1.90 -1.20 -2.89 -0.53
T | -1.37 -3.13  1.11  0.92 -3.28 -1.96  0.84 -3.00 -3.13  0.91
CAD1Pachkov et alP = 9.20e-25View matrix ↘
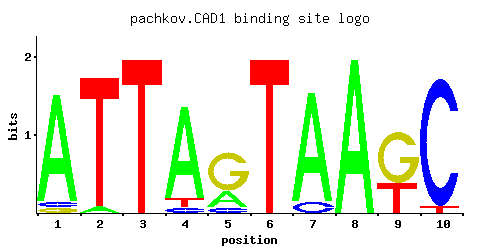
A | 0.912 0.044 0.001 0.875 0.264 0.001 0.904 1.000 0.001 0.001
C | 0.044 0.001 0.001 0.045 0.093 0.001 0.096 0.001 0.001 0.956
G | 0.043 0.001 0.001 0.001 0.642 0.001 0.001 0.001 0.640 0.001
T | 0.001 0.956 1.000 0.080 0.001 1.000 0.001 0.001 0.360 0.044
A |  91   4   0  87  26   0  90 100   0   0
C |   4   0   0   4   9   0   9   0   0  95
G |   4   0   0   0  64   0   0   0  64   0
T |   0  95 100   8   0 100   0   0  36   4
A |  1.05 -1.98 -5.77  1.01 -0.19 -5.77  1.04  1.14 -5.77 -5.77
C | -1.41 -5.19 -5.19 -1.39 -0.66 -5.19 -0.63 -5.19 -5.19  1.67
G | -1.43 -5.19 -5.19 -5.19  1.27 -5.19 -5.19 -5.19  1.27 -5.19
T | -5.77  1.09  1.14 -1.39 -5.77  1.14 -5.77 -5.77  0.12 -1.98
Gene-level annotations and interactions.
Genes bound in ChIP-chip experiments 68 genes
YAL058W, YBL008W, YBL034C, YBR046C, YBR047W, YBR057C, YBR280C, YCR037C, YDL104C, YDL239C, YDR036C, YDR037W, YDR132C, YDR135C, YDR137W, YDR543C, YEL044W, YEL045C, YEL046C, YER141W, YGL115W, YGL157W, YGR167W, YGR233C, YGR234W, YHL039W, YHL040C, YHR008C, YHR048W, YHR053C, YHR055C, YHR077C, YHR078W, YHR091C, YHR133C, YHR134W, YJL100W, YJL101C, YJR044C, YKL039W, YKL040C, YKL086W, YKL087C, YKL101W, YKL102C, YKL103C, YKL154W, YKL155C, YKR052C, YKR071C, YLL002W, YLL060C, YLL065W, YLR108C, YLR109W, YLR456W, YML116W, YML133C, YMR038C, YNL134C, YNL337W, YOL077W-A, YOL078W, YOL080C, YOL119C, YOR173W, YPL283C, YPR048W
Genes affected by TF deletion 105 genes
YJR048W, YMR192W, YOR377W, YBL087C, YOR192C-B, YOR258W, YEL017C-A, YHR145C, YLR089C, YPL016W, YOL104C, YLR152C, YLR184W, YMR258C, YOR133W, YOR165W, YPL084W, YGR064W, YMR102C, YCL020W, YDR281C, YGR183C, YML022W, YBR012C, YCR050C, YCL065W, YDR410C, YHR001W-A, YAR010C, YHR152W, YLR410W-B, YOR043W, YOR075W, YPL060W, YCR093W, YCL058C, YJR027W, YNR066C, YJR148W, YGR161C, YGR161W-B, YLR035C-A, YLR099C, YHR214C-B, YIL060W, YJL191W, YMR291W, YPL156C, YDL040C, YLR345W, YMR108W, YMR110C, YOR356W, YPR055W, YDL231C, YHR214C-C, YCR024C-A, YER129W, YGR294W, YIL100W, YBR235W, YGR164W, YLR110C, YBL101W-A, YDR417C, YGL188C, YOL059W, YEL060C, YKL120W, YKL030W, YPR002W, YDR298C, YKL221W, YOL119C, YPR035W, YHR136C, YJL143W, YBL107W-A, YCR031C, YFL002W-B, YER138W-A, YIL133C, YIL103W, YLR300W, YPL228W, YDR210W-A, YDR210W-C, YDR213W, YHR135C, YJL076W, YMR211W, YPL075W, YPR158W-B, YDL023C, YOL103W-A, YOR343C-B, YIL011W, YKL192C, YDL022W, YLR395C, YMR123W, YPR043W, YGR209C, YIL069C, YML081C-A
Genes supported by both experiments 1 genes
YOL119C