← All factors / TF RECORD
ASG1
YIL130W
Zinc cluster protein proposed to function as a transcriptional regulator involved in the stress response; null mutants have a respiratory deficiency, calcofluor white sensitivity and slightly increased cycloheximide resistance
01 / RECOMMENDED MATRIX
Best-performing DNA-binding model.
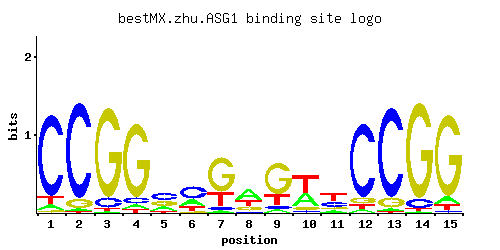
Fisher’s P-value0.2051
Information content16.58
Max PWM score18.47
Recommended cutoff9.58
View and copy the recommended matrices ↘
Position frequency matrix (PFM)
A | 0.05 0.02 0.01 0.05 0.23 0.26 0.04 0.48 0.06 0.35 0.11 0.04 0.02 0.01 0.07
C | 0.85 0.89 0.10 0.07 0.42 0.50 0.06 0.07 0.07 0.06 0.32 0.84 0.87 0.08 0.02
G | 0.02 0.08 0.87 0.84 0.28 0.06 0.65 0.22 0.65 0.08 0.14 0.07 0.10 0.89 0.85
T | 0.07 0.01 0.02 0.04 0.06 0.17 0.25 0.23 0.22 0.51 0.43 0.05 0.01 0.02 0.05
Position count matrix (PCM)
A |   5   2   1   5  23  26   4  48   6  35  11   4   2   1   7
C |  85  89  10   7  42  50   6   7   7   6  32  84  87   8   2
G |   2   8  87  84  28   6  65  22  65   8  14   7  10  89  85
T |   7   1   2   4   6  17  25  23  22  51  43   5   1   2   5
Position weight matrix (PWM)
A | -1.86 -2.77 -3.47 -1.86 -0.33 -0.21 -2.08  0.41 -1.67  0.09 -1.07 -2.08 -2.77 -3.47 -1.52
C |  1.55  1.60 -0.59 -0.94  0.85  1.02 -1.10 -0.94 -0.94 -1.10  0.58  1.54  1.58 -0.81 -2.20
G | -2.20 -0.81  1.58  1.54  0.44 -1.10  1.28  0.20  1.28 -0.81 -0.25 -0.94 -0.59  1.60  1.55
T | -1.52 -3.47 -2.77 -2.08 -1.67 -0.63 -0.25 -0.33 -0.37  0.47  0.30 -1.86 -3.47 -2.77 -1.86
02 / COMPARATIVE BENCHMARKS
Alternative candidate matrices 2
Historical matrix candidates from the original ScerTF database. Expand a source to inspect its original logo, scores, and matrix values.
ASG1Badis et. al.P = 0.01485View matrix ↘
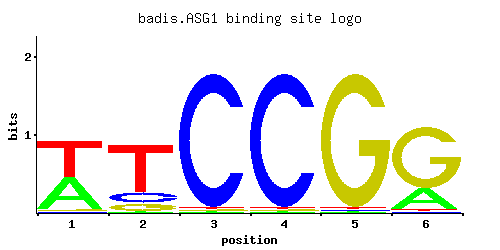
Fisher’s P-value0.01485
Information content9.208
Max PWM score7.77
Recommended cutoff4.39
Position frequency matrix (PFM)
A | 0.01 0.01 0.01 0.01 0.72 0.52
C | 0.75 0.97 0.01 0.01 0.11 0.01
G | 0.01 0.01 0.97 0.97 0.16 0.01
T | 0.24 0.01 0.01 0.01 0.01 0.46
Position count matrix (PCM)
A |   1   1   1   1  72  52
C |  75  97   1   1  11   1
G |   1   1  97  97  16   1
T |  24   1   1   1   1  46
Position weight matrix (PWM)
A | -3.47 -3.47 -3.47 -3.47  0.81  0.49
C |  1.43  1.68 -2.89 -2.89 -0.49 -2.89
G | -2.89 -2.89  1.68  1.68 -0.12 -2.89
T | -0.29 -3.47 -3.47 -3.47 -3.47  0.36
ASG1Zhao and StormoP = 0.00759View matrix ↘
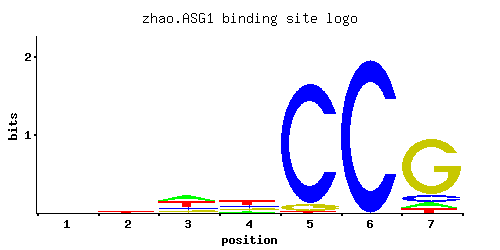
Fisher’s P-value0.00759
Information content6.089
Max PWM score5.92
Recommended cutoff4.9
Position frequency matrix (PFM)
A | 0.053 0.001 0.007 0.416 0.360 0.320 0.268
C | 0.779 0.001 0.053 0.207 0.125 0.242 0.228
G | 0.099 0.997 0.939 0.247 0.134 0.240 0.240
T | 0.068 0.001 0.001 0.130 0.382 0.198 0.265
Position count matrix (PCM)
A |   5   0   0  41  36  32  26
C |  77   0   5  20  12  24  22
G |   9  99  93  24  13  24  24
T |   6   0   0  13  38  19  26
Position weight matrix (PWM)
A | -1.80 -5.77 -3.82  0.26  0.12  0.00 -0.18
C |  1.47 -5.19 -1.22  0.14 -0.36  0.30  0.24
G | -0.60  1.71  1.65  0.32 -0.30  0.29  0.29
T | -1.55 -5.77 -5.77 -0.90  0.18 -0.48 -0.19
03 / EXPERIMENTAL CONTEXT
Gene-level annotations and interactions.
Genes bound in ChIP-chip experiments 1 genes
No Data
Genes affected by TF deletion 1 genes
No Data
Genes supported by both experiments 1 genes
No Data