ACA1
YER045C
Basic leucine zipper (bZIP) transcription factor of the ATF/CREB family, may regulate transcription of genes involved in utilization of non-optimal carbon sources
Best-performing DNA-binding model.
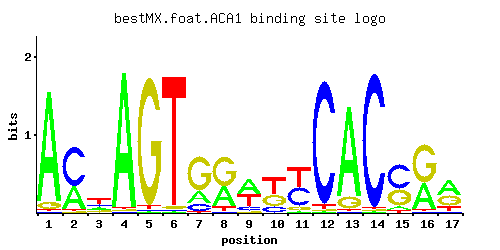
View and copy the recommended matrices ↘
A | 0.92 0.35 0.17 0.97 0.01 0.01 0.21 0.36 0.46 0.01 0.02 0.01 0.87 0.01 0.06 0.39 0.47
C | 0.01 0.62 0.22 0.01 0.01 0.01 0.13 0.01 0.13 0.19 0.44 0.95 0.01 0.97 0.54 0.01 0.04
G | 0.06 0.02 0.16 0.01 0.96 0.02 0.65 0.56 0.04 0.33 0.09 0.01 0.12 0.01 0.36 0.59 0.35
T | 0.01 0.02 0.45 0.01 0.02 0.96 0.01 0.07 0.37 0.47 0.46 0.03 0.01 0.01 0.04 0.02 0.14
A |  92  35  17  97   1   1  21  36  46   1   2   1  87   1   6  39  47
C |   1  62  22   1   1   1  13   1  13  19  44  95   1  97  54   1   4
G |   6   2  16   1  96   2  65  56   4  33   9   1  12   1  36  59  35
T |   1   2  45   1   2  96   1   7  37  47  46   3   1   1   4   2  14
A |  1.06  0.09 -0.63  1.11 -3.47 -3.47 -0.42  0.12  0.36 -3.47 -2.77 -3.47  1.00 -3.47 -1.67  0.20  0.38
C | -2.89  1.24  0.20 -2.89 -2.89 -2.89 -0.33 -2.89 -0.33  0.05  0.89  1.66 -2.89  1.68  1.10 -2.89 -1.50
G | -1.10 -2.20 -0.12 -2.89  1.67 -2.20  1.28  1.13 -1.50  0.61 -0.69 -2.89 -0.41 -2.89  0.69  1.19  0.66
T | -3.47 -2.77  0.34 -3.47 -2.77  1.10 -3.47 -1.52  0.15  0.38  0.36 -2.37 -3.47 -3.47 -2.08 -2.77 -0.83
Alternative candidate matrices 1
Historical matrix candidates from the original ScerTF database. Expand a source to inspect its original logo, scores, and matrix values.
ACA1Morozov et. al.P = 1View matrix ↘
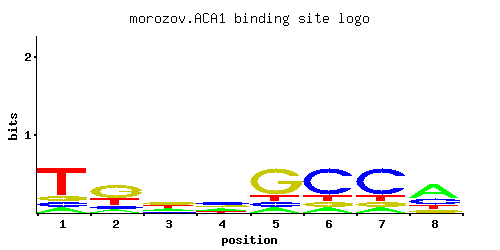
A | 0.116 0.116 0.116 0.116 0.116 0.256 0.233 0.651
C | 0.116 0.116 0.116 0.651 0.256 0.372 0.535 0.116
G | 0.233 0.651 0.651 0.116 0.372 0.116 0.116 0.116
T | 0.535 0.116 0.116 0.116 0.256 0.256 0.116 0.116
A |  11  11  11  11  11  25  23  65
C |  11  11  11  65  25  37  53  11
G |  23  65  65  11  37  11  11  11
T |  53  11  11  11  25  25  11  11
A | -1.01 -1.01 -1.01 -1.01 -1.01 -0.22 -0.32  0.71
C | -0.44 -0.44 -0.44  1.29  0.35  0.73  1.09 -0.44
G |  0.26  1.29  1.29 -0.44  0.73 -0.44 -0.44 -0.44
T |  0.51 -1.01 -1.01 -1.01 -0.22 -0.22 -1.01 -1.01
Gene-level annotations and interactions.
Genes bound in ChIP-chip experiments 14 genes
YAR064W, YBR012C, YBR013C, YBR061C, YBR254C, YBR255W, YDR332W, YHR164C, YHR191C, YHR192W, YOL072W, YOL073C, YPL078C, YPL172C
Genes affected by TF deletion 110 genes
YCR040W, YGR280C, YIL146C, YKR012C, YNL050C, YGL009C, YCR013C, YKR013W, YMR044W, YFR005C, YHR025W, YIR034C, YLR340W, YLR372W, YOR351C, YPL187W, YHR208W, YML085C, YBR067C, YDR461W, YLR339C, YNL146W, YCL012W, YCL018W, YIL015W, YNL300W, YCL065W, YNR071C, YOR229W, YHR184W, YJL121C, YLR439W, YMR202W, YNL279W, YIL151C, YJR148W, YAL012W, YAL014C, YER001W, YDR502C, YOL086C, YPL280W, YKL209C, YKL178C, YNR035C, YPL092W, YFL052W, YGR038W, YLR343W, YOL111C, YOL143C, YOR221C, YAR075W, YBL032W, YDR344C, YJL158C, YKL177W, YNL312W, YOR239W, YOR243C, YLR040C, YLR420W, YCL066W, YKR086W, YAL018C, YBR240C, YGR137W, YGR109W-A, YHR133C, YJL068C, YJL102W, YKL089W, YKL120W, YLR041W, YLR444C, YOR084W, YPL067C, YPR097W, YCR097W, YFL026W, YOL126C, YBR273C, YGL089C, YFL023W, YBL073W, YGR233C, YJR004C, YKL216W, YMR303C, YNR044W, YNL322C, YPL163C, YLR303W, YOR245C, YOR247W, YEL038W, YML019W, YOR063W, YLR302C, YOR246C, YOR248W, YGL032C, YPL044C, YOR034C, YGR274C, YMR276W, YDL211C, YER073W, YKL197C, YPR176C
Predicted TF–TF partners 4 genes
GCN4, MSN2, MSN4, RTG3